UK Energy Research Centre (UKREC) doubly misleads

Yesterday the GWPF and Joanne Nova point to an article in Thursday’s Daily Express which declared

A report from the UK Energy Research Centre also shows the number of those who resolutely do not believe in climate change has more than quadrupled since 2005.

There are two fundamental issues with the press release. First the research shows a much bigger divergence in public opinion from climate orthodoxy than the press release by the QUANGO shows. Second, the opinion poll conducted in England, Scotland and Wales by psychologists had two fundamental errors that fail to connect with the real world situations that people are facing and will face in the renewable energy future.

Public Opinion on Climate Change

The Government funded report shows 19 per cent of people are climate change disbelievers – up from just four per cent in 2005 – while nine per cent did not know.

The Daily Express article only looks at the press release and then speaks to UK Green Party leader Natalie Bennett, who says, who says

Of course, however, the 72 per cent of the public who acknowledge the climate is changing are backed overwhelmingly by the scientific evidence.

If they had clicked on the second link on point 3 (of 5) in the “Notes to the Editors” (below where it says – Ends –) labelled “national survey“, they would have opened up the 62 page “SURVEY FINAL.pdf”. If they had then gone to Appendix B, they would have found the full results of all 72 survey questions. The following is relevant

Q3. How concerned, if at all, are you about climate change, sometimes referred to as ‘global warming’?

“Very” or “Fairly” concerned         74%

“Not very”, or “Not at all” concerned      26%

Don’t know                 1%

However, this should be more relevant.

Q5. Thinking about the causes of climate change, which, if any, of the following best describes your opinion?

CC is entirely or mainly caused by natural processes                 16%

CC is partly caused by natural processes and partly caused by human activity     48%

CC is entirely or mainly caused by human activity                 32%

The survey shows that two-thirds of the public disagree with the “scientists”, and thus disagree with a necessary condition to justify policy – that climate change is a non-trivial problem. The press release hides the real story in obscure places that no journalist has time to find.

The opinion poll failing to address real world situations

The questionnaire started with questions on attitudes to climate change. However, the vast majority of the questions, and the purpose of the survey, was upon the “Public Values, Attitudes and Acceptability” of pursuing the UK’s transformation to “green” energy. As this questionnaire was conducted by the School of Psychology at the University of Cardiff, there are two things one could reasonably expect.

  1. Empathy with the people impacted.
  2. Addressing the costs that people are most likely to face.

In both there is a depersonalisation of the impacts.

One of the most controversial areas of renewables is wind turbines. An innocuous question is

Q22. To what extent would you support or oppose the building of a new wind farm in your area? (By ‘area’ we mean up to approximately 5 miles from your home)?

The distance is relevant. Like the vast majority of people I live in a built-up area. If the world’s tallest building was located five miles from my house, I would likely not be able to see it from the ground floor in any direction. Five miles distant there is an airport with 20 million passengers and 170,000 flight movements a year. I rarely hear an aircraft, as I do not under the usual flight paths. To personalize it, you need to ask people if, when purchasing a house, having a wind turbine located at less than a mile from a house, clearly visible, would affect the decision to buy it.

This depersonalisation of the impacts also includes the benefits. In a remote rural area a nuclear power plant would bring a huge influx of jobs and prosperity, more than thousands of wind farms. There is a relevant example. In the 1960s Caithness boomed as a result of the building Dounreay nuclear research plant. The county is currently being overrun by wind turbines, which do little to replace the jobs lost as the nuclear facility is decommissioned.

Empathizing with the plight of a minority who are adversely affected by renewables is something that should be appreciated. However, for most people, it is the direct impact of renewables that will concern them most. For the vast majority, it is costs that are important. UKERC fully realize that switching from fossil fuels to renewables means receiving power solely in the form of electricity. Therefore, there are questions about switching from gas to electric for heating and cooking, and about the public perceptions of electric cars.

Q23. How positive or negative do you feel about heating with electricity?

Q24. Please indicate how willing you would be, if at all, to use electric heating in your home in the future.

Q25. …what if your friends, family and neighbours used electric heating? How willing would you be, if at all, to use electric heating in the future if this was the case?

Q26. …what if the performance of electric heating was no different to central gas heating systems? How willing would you be, if at all, to use electric heating in the future if this was the case?

Q27. …what if electric heating was significantly cheaper than heating with gas? How willing would you be, if at all, to use electric heating in the future if this was the case?

Q28. How positive or negative do you feel about cooking only with electricity?

Q29. Please indicate how willing you would be, if at all, to cook only with electricity in the future.

Q30. …what if your friends, family and neighbours cooked only with electricity? How willing would you be, if at all, to cook with electricity in the future if this was the case?

Q31. …what if the performance of an electric hob was no different to a gas hob (e.g. it heats up in the same time)? How willing would you be, if at all, to use an electric hob in the future if this was the case?

Q32. …what if cooking with electricity was significantly cheaper than cooking with gas? How willing would you be, if at all, to cook with electricity in the future if this was the case?

Q33. How positive or negative do you feel about driving an electric car?

Q34. Please indicate how willing you would be, if at all, to drive an electric car in the future.

Q35. …what if your friends, family and neighbours drove electric cars? How willing would you be, if at all, to drive an electric car in the future if this was the case?

Q36. …what if the performance of an electric car was the same as a petrol car (e.g. speed, range, availability of charging points)? How willing would you be to drive an electric car in the future if this was the case?

Q37. …what if the cost of buying and running an electric car was significantly less than the cost of a petrol car? How willing would you be, if at all, to drive an electric car in the future if this was the case?

UKREC could say they have dealt with costs in Q27, Q32 and Q37. But this only deals with the scenario if the electric alternative is cheaper. Currently the electric alternative is far more expensive. Maybe twice the cost for heating by electric than gas, and an electric car is around twice the cost (or more) of an equivalent size of diesel car. Will the reality change? There are four reasons why not, which need to be compared with the current domestic price (after distribution costs, reseller costs and reseller margin) of 10p Kwh.

First, is that renewables cost more, in total, per unit of electricity than fossil-fuelled power stations. When I last checked it was 4.1p for onshore turbines and 8.3p Kwh for offshore. This is on top of the wholesale market rate. In addition, there is the STOR energy scheme where the marginal cost per Kwh is over 20p-30p Kwh, and the average cost per Kwh could be 50p or more. Then there are the payments not to shut the things off when the wind blows too strongly.

Second, is that fossil fuels are likely to come down in price than go up. In particular in Britain the shale gas revolution will guarantee supplies for a generation and are more likely to see gas prices fall in real terms, than rise.

Third, is that if we switch energy from gas and petrol/diesel to electric, the amount of electric power generation capacity required will go through the roof. The first point applies even more strongly.

Fourth is that current technologies are developing rapidly as well. For an electric car to become competitive on running costs, it needs to overtake the next generation of diesel cars. For instance, last week I drove one of the current Volkswagen Golf diesels, a 1.6TDI. The fuel consumption of just over 60mpg(1), was at least 25% better than a 2007 Vauxhall (General Motors) Astra 1.7TDI, and 100% better than my first car – the much smaller 1978 Honda Civic 1.2 petrol.

Conclusion

The press release fails to show how far out of line the consensus of climate scientists are with mainstream public opinion. More importantly, a questionnaire commissioned by a QUANGO for renewable energy research and conducted by academic psychologists, fails to address the likely real situations people will face under a renewable future.

Kevin Marshall

  1. For Australians and Europeans, 60 miles per gallon is 4.7 litres per 100km. For those in the United States it is about 50 miles per US gallon.

Blocked by the Great Firewall of China?

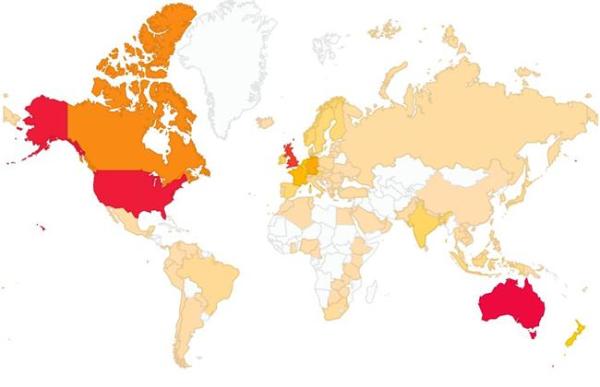
One of the advantages of using WordPress is that they provide details of the countries where hits originate from. It is fascinating to see that in the last 18 months I have received hits from well over 100 countries.


As I have only posted in English, it is not surprising that the top three countries, accounting for nearly three-quarters of all hits are Australia, United States, UK (where I live). Yet there are fully 23 nations where I have received just one hit. As I have never mentioned countries such as Laos, Saint Lucia, Papua New Guinea or Ghana, Given that they have small numbers of people and/or with limited internet access, and having mentioned these countries, then this is not surprising. But there is one glaring anomaly in these 23 nations – China. With over 20% of the world’s population, and having mentioned the country at least once – on China’s Coal to Oil Policy – this is at first surprising. Maybe it is the Great Firewall of China that is blocking me. However, there is a site http://greatfirewallofchina.org. The results show that my site is not blocked. This is further confirmed by over half my spam is from China, often with Chinese script.


The explanation might be that the Great Chinese Fire Wall acts like Google incognito window.

I tested some other sites and got mixed results. BBC.co.uk and wattsupwiththat are not blocked. Amongst those blocked are amazon.co.uk, telegraph.co.uk. thegwpf.org and ebay.co.uk.

There is a couple of lesson’s here. First is that no matter how good you consider the data, (and WordPress has, I am sure, site stats to the highest standards) it may not capture everything. Secondly, when statistics do not add up, it is easy to come to a conspiracy conclusion. It might be that you are ignored because you are not recognized, or in being recognized others do not give two hoots to your opinions. Below is the Chinese translation, to act as a test. A further test is to mention Tiananmen Square Massacre 1989, and post the posting in Chinese – See below.

使用WordPress的优势之一是,他们提供的点击来自的国家。有趣的是可以看到,在过去的18个月中,我已经收到命中以及超过100个国家和地区。

正如我刚才只张贴英语,这并不奇怪,把上面三个国家占近四分之三的所有点击,澳大利亚,美国,英国(我住的地方)
。然而,是完全有23个国家在那里我只收到一击。因为我从来没有提到国家如老挝,巴布亚新几内亚,圣卢西亚或加纳,鉴于他们有少量的人及/或有限的互联网接入,并在提到这些国家,那么这是不奇怪的。但在这23个国家 – 中国,有一个明显异常。随着世界人口的20%以上,至少有一次提到国家 – 中国煤炭石油政策 – 这是第一个令人惊讶的。也许这是伟大的中国防火墙阻止我。然而,有是一个网站http://greatfirewallofchina.org的。结果表明,我的网站没有被阻塞。这进一步证实了我的垃圾邮件的一半以上是来自中国,经常与中国的脚本。

解释可能是伟大的中国防火长城就像谷歌隐身窗口。

我测试了其他一些网站,并得到了好坏参半的结果。 BBC.co.uk wattsupwiththat没有阻塞。当中那些阻塞amazon.co.uk , telegraph.co.uk 。 thegwpf.org和ebay.co.uk.

这里有一对夫妇的教训。首先是再好你考虑数据(和WordPress网站统计的最高标准)
,我敢肯定,它可能无法捕捉一切。其次,当统计加起来不,它很容易阴谋的结论来。这可能是被忽略,因为你不承认,或在被认可别人不给两个鸣响您的意见。下面是中文翻译,作为一个测试。进一步的测试是提到天安门大屠杀1989年,发布张贴在中国 – 见下文。

Fundamentals that Climate Science Ignores

Updated 08/09/13 am

Updated 08/09/13 pm – M The Null Hypothesis

Climate Science is a hugely complex subject, dealing with phenomena that are essentially chaotic, with vague patterns. Yet the promotion of that science is banal and superficial. Below are some of the fundamentals that have been addressed in established areas like economics, philosophy and English Common Law, but which the Climate Science community ignores. Most overlap, or are different ways of looking at the same thing.

A Positive and Normative

I do not hold with the logical positivism in vogue in the early parts of the C20th and later underpinning the “positive economics” ideas of Milton Friedman that was popular in the 1950s to 1980s. But it made the useful distinction between positive statements (empirically based statements) and normative statements (what ought to be). The language of climate science is heavily value-laden. There is not attempt to distinguish positive from normative in language, nor highlight that competency in the sphere of positive statements is not necessarily an indication of competency in normative ones.  For instance, when scientists make statements about the moral imperative for policy, they may overemphasize the moral questions raised as they may be too close to the subject. In fact believing that that rising greenhouse gas levels causes a worsening of climate can lead to a bias towards the simplified solution to constrain that growth. It takes understanding of the entirely separate fields of economics and public policy-making to determine whether this is achievable, or the best solution.

B Boundary conditions

There is no clear definition of science in general or the study of climate in particular. The only underlying definitions are tantamount to saying that science is what scientists do, and scientific statements are those made by scientists. Without a clear definition of science, scientists end up making unsupported statements, outside their area of competency. For instance, scientists often make statements about the economic case for policy. With the term “climate change” encompassing both, the general public are misled into believing that “climate scientists” cover both areas.

C Open and closed questions

A closed question can by answered by a single word. The narrowest closed questions are those can be answered “Yes/No” or “True/False”. Open questions need fuller answers. Climate change is not just about closed questions. It is about how much, how likely, when and where. If terms of boundary, there is not a closed question of science versus non-science – with the boundary in actual work being between that published in a peer-reviewed journal and that published outside. That leads onto non-triviality and quality conditions and relevancy

D Trivial v. Non-trivial

The strongest evidence for global warming suggests a trivial issue. In one aspect this is true by definition. The non-trivial part – the potential climate catastrophe that policy seeks to avert – relies upon future projections. This relies on temperature rises many times greater than so far experienced. Projections will always be, weaker that the actual evidence. But there is an empirical aspect as well. If the actual trends are far below those predicted (surface temperature warming trends), or fail to show a switch to a path pointing to catastrophe (acceleration in the rate of sea level rise)

E Quality

There is good quality science and poor quality. Peer review should help, but (as suggested in the Climategate emails) acceptance/rejection can be based on criteria other than science. In most areas of science, and indeed in many professions, efforts have been made to improve the quality of results. One minor step towards improvement of quality is the insistence on publishing the data behind peer-reviewed articles. This has led to the quick exposure of shoddy work like Gergis et al 2012 and LOG12 papers, whereas it took many years of persistence by Steve McIntyre to get the full data on Keith Briffa’s deeply flawed Yamal tree-ring temperature proxy. However, as the forthcoming UNIPCC AR5 report will demonstrate, increasing quality is sacrificed in promoting climate catastrophism.

F False Positives and False Negatives

A particular subset of the quality issue is that of false positives and false negatives. With activists pressuring governments and scientific bodies to agree with the dogma, and promotion of pejorative language (e.g. deniers, fake skeptics), misattribution of significant weather events to climate change is a consequence. Whilst in cancer screening there have been efforts made to reduce the number of false positives and false negatives, in climate science there seems to be every effort to increase the numbers of false positives. (Superstorm Sandy that hit New York state last year, the extreme heat wave in Europe in 2003, the low sea ice point in September 2012).

G Relevancy and significance

Some pieces of information, or scientific papers, are more important than others. The vast majority of papers published are on trivial issues and/or fail to make a lasting impact. In terms of catastrophic global warming, most papers in the field are tangential to the subject. The same is true of items of information, statistics and opinions.

H Necessary and Sufficient

For a climate policy to give net benefits, a number of conditions are necessary, both in the science (greenhouse gas effect, significant warming, adverse consequences) and in policy area (policy with theoretical net benefits > costs of doing nothing, large enough policy area, effective policy management). Sufficient for policy success (net policy benefits > costs of doing nothing) all are to some extent necessary. For policy failure, it is only sufficient for one of the necessary conditions to fail. It does not matter whether this is

–       climate sensitivity being much lower than assumed

–       or adaptation at the non-governmental local level is much more effective than assumed

–       or the net adverse consequences of any given amount of warming are grossly exaggerated

–       or the theoretical economic case for policy is flawed (such as demand for energy is far more inelastic with respect to price over time than assumed, or that renewable energy is not a close substitute to fossil fuel energy)

–       or the actual policy enacted does not encapsulate the economic theory, diluting or nullifying the effectiveness

–       or unilateralist policy where success requires that the vast majority of the biggest economies to participate

–       or the policy on paper is potentially successful, but it is not project managed to drive through the maximum benefits at least cost

I Levels of evidence

In the legal systems, especially in criminal law, it has long been recognized that there are different qualities of evidence. The strongest is DNA, fingerprints, or catching somebody in the act. There is then secondary evidence from witnesses. There is then circumstantial evidence, such as the accused being near to the scene at the time, with no clear reason to be there. The lowest form of evidence, and usually rejected, is hearsay evidence. That is opinions of people with little interest in the case, giving unsupported opinions. The judicial process also views more highly evidence that is corroborated by other pieces of evidence, and evidence that on its own seems quite strong is downgraded or ruled out by contrary evidence, or alternative explanations.

J Values of the Legal Process in Reverse

Climate science, fails to grapple with the grading of evidence, as some its strongest arguments – consensus amongst scientists – is actually hearsay. Improving the quality of evidence would mean critically examining past forecasts in the light of evidence. In the judicial process, creating prejudice in the eyes of the jury against the defendants, or seeking to deny the accused a defence, is forcefully dealt with. Creating prejudice and denying a voice to those who question the climate change dogmas is viewed as part of the cause.

K Underdetermination Thesis

“The underdetermination thesis – the idea that any body of evidence can be explained by any number of mutually incompatible theories”

Quote from Kuhn vs Popper – Steve Fuller 2003

The global warming hypothesis is but one of a number of hypotheses trying to explain why climate changes over time. The problem is not just of a potential number of competing theories. It is that there might be a number of different elements influencing climate, with the various weightings dependent on the method and assumptions in analysis. It is not just trying to determine which one, but which ones and to what extent that they interplay.

L Vulnerability

Every scientific hypothesis is vulnerable to being refuted. Human-caused catastrophic global warming (CAGW) is based on extremely tentative assumptions, and is a forecast of future events. As the warming the past one hundred years is tiny compared that forecast to happen in the future, and that warming is partly obscured by natural variations, then the signal of future catastrophe will be weak. The issue is further clouded by the lack of long periods of data on climate variability before when human emissions became significant. That is data prior to 1945, when the post war economic boom led to a huge increase in human emissions. Assuming the forecasts of CAGW are correct, the hypothesis becomes incredibly vulnerable to rejection.
But if CAGW is false, or massively exaggerated, then the hypothesis is deeply susceptible to confirmation bias by those who only look to find evidence of its truth. The core belief of climate science is that the catastrophist hypothesis is true and the job of the “science” is to reveal this truth. The core mission of many co-believers is to stop any questioning of these core beliefs. The alternative view is that evidence for CAGW has become stronger over the last twenty-five years, making the hypothesis less vulnerable over time. This can be tested by looking at the success of the short-term predictions.

M The Null Hypothesis

Wikipedia’s definition is

In statistical inference of observed data of a scientific experiment, the null hypothesis refers to a general or default position: that there is no relationship between two measured phenomena,…… Rejecting or disproving the null hypothesis – and thus concluding that there are grounds for believing that there is a relationship between two phenomena …………….. – is a central task in the modern practice of science, and gives a precise sense in which a claim is capable of being proven false.

It applies to AGW theory, as the hypotheses are empirical relationships. With highly complex, and essentially chaotic, systems it is only by confronting the data using a battery of statistical tests that you can disprove the null hypothesis. Without the null hypothesis, and without such rigorous testing, all the data and observations will only confirm what you want to believe. Some of the best established empirically-based hypotheses, like “HIV causes AIDS” and “long-term heavy smoking significantly reduces life expectancy” have been confronted with the null hypothesis many times against large, high quality data sets. At extremely high levels of significance, the null hypothesis of no relationship can be rejected.

It could be claimed that the null hypothesis in not applicable to AGW theory as it forecasts something much worse happening than has so far been experienced. However, it is more important because of this. There is no bridge between reality and the theoretical relationships (with assumed magnitudes) in the climate models. The null hypothesis (general or default position) for testing against actual data is not that there is no relationship, but the double-negative of no non-trivial relationship. So the null hypothesis for testing “CO2 causes warming”, is not “CO2 does not affect temperature”, but “CO2 has no non-trivial impact on warming”. The reason is that the claimed requirement for policy is avoidance of a climate catastrophe, with relationships being non-trivial in magnitude.

Was the twentieth century warming mostly due to human emissions?

There has been no statistically significant warming for at least 15 years. Yet some people, like commentator “Michael the Realist”, who is currently trolling Joanne Nova’s blog, are claiming otherwise. His full claims are as follows

Again look at the following graph.

Now let me explain it to the nth degree.
# The long term trend over the whole period is obviously up.
# The long term trend has pauses and dips due to natural variations but the trend is unchanged.
# The current period is at the top of the trend.
# 2001 to 2010 is the hottest decade on the record despite a preponderance of natural cooling trends. (globally, ocean, land and both hemispheres)
# Hotter than the previous decade of 1991 to 2000 with its preponderance of natural warming events.
# Every decade bar one has been hotter than the previous decade since 1901.

Please explain why the above is true if not AGW with proof.

The claims against the warming standstill I will deal with in a later posting. Here I will look at whether the argument proves, beyond reasonable doubt, that AGW exists and is significant.

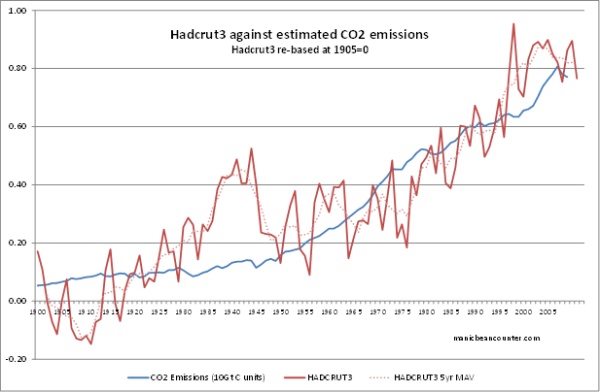
There might be a temperature series, but there is no data on greenhouse gases. There is data on the outcome, but there is no presentation of data on the alleged cause. It is like a prosecution conducting a murder trial with a dead body, with the cause of death not established, and no evidence presented linking the accused to the death. I will have to fill this bit in. The alleged cause of most of the twentieth century global warming is human greenhouse gas emissions. The primary greenhouse gas emission is CO2. First I will compare estimated global CO2 emissions with the warming trend. Second, I then show evidence that the twentieth century warming is nothing exceptional.

The relationship of CO2 emissions to average temperature is weak

Some time ago I downloaded estimates of national CO2 emissions data from what is now the CDIAC website, then in filled my own estimates for all major countries where there were data gaps, using the patterns of other countries and my knowledge of economic history. This shows steady growth up to 1945 (with dips in WW1, the Great Depression and at the end of WW2) The post war economic boom, the 1973 oil crisis, the recession of 1980-81 and the credit crunch of 2008 are clearly visible. It therefore seems reasonable and not too dissimilar from the increase in atmospheric CO2 levels.


I have charted the growth in human CO2 emissions against the HADCRUT3 data, putting them on a comparative scale. The 5 year moving average temperature increased by around 0.5oC between 1910 and 1944 and 0.6oC between 1977 and 2004. In the former period, estimated CO2 emissions increased from 0.8 to 1.4 giga tonnes. In the latter period, estimated CO2 emissions increased from 4.9 to 7.4 giga tonnes. The period in between the 5 year moving average temperature decreased very slightly and CO2 emissions increased from 1.4 to 4.9 giga tonnes. 1945 and the late 1998 have two things in common – the start of a stall in average surface temperature increases and an acceleration in the CO2 emission rate of increase. On the face of it, in so far as there is a relationship between CO2 emissions and temperature, it seems to be a pretty weak one.

The longer view

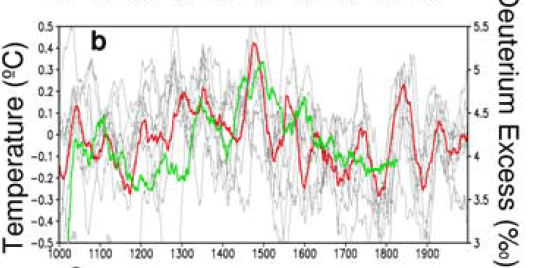
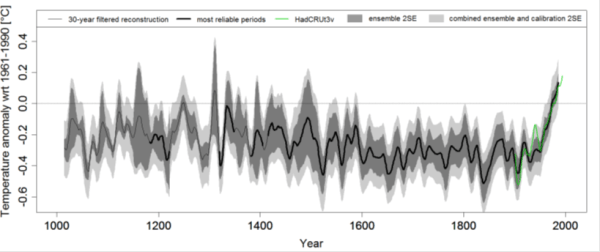
The case for claiming human emissions affect temperature is even weaker if you take a longer perspective. Human CO2 emissions were negligable before the industrial revolution, yet there is plenty of evidence that temperatures have shown larger fluctuations in last couple of millennia. Four example are Law Dome, Esper et al 2012, Gergis et al 2012 and the CO2 Science website.

This Law Dome ice cores are the highest quality ice cores in Antarctica.


There seems to be no warming there at all. With 75% of the global ice packs in Antarctica it is fortunate that there is nothing exceptional about Antarctica warming. But maybe the Arctic is different.

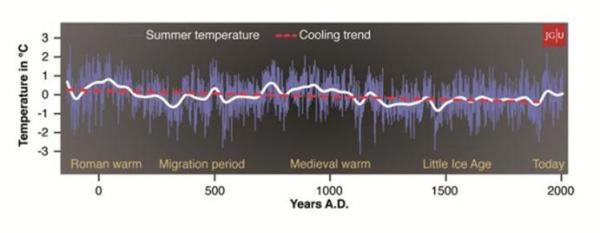
Esper et al 2012, published in Nature, has the following Summer temperature reconstruction for Northern Scandinavia over two millennia.


There is a twentieth century uptick, but only in the context of a long term cooling trend.

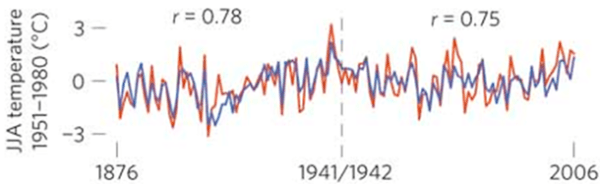
Focussing on the last 130 years shows something at odds with the global position.


The highest temperatures were in the 1930s, just like the record temperatures in the USA. The warming trend from the mid-1970s is still far greater than the global averages, but less than the warming trends in the early twentieth century. It corroborates data that shows recent warming trends are higher in the Arctic than the global average, but also shows claims that there is nothing significant in these trends.

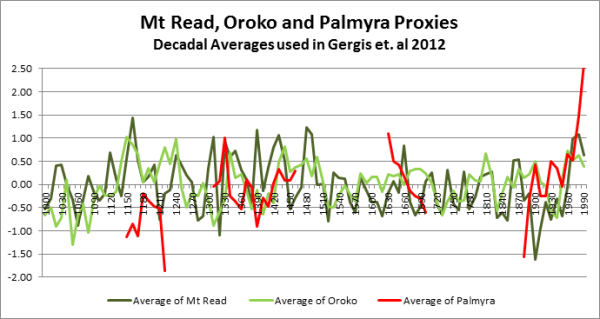
I find the most convincing evidence is from the withdrawn Gergis 2012 temperature reconstruction for the combined land and oceanic region of Australasia (0°S-50°S, 110°E-180°E). This is because it set out with the aim of showing the opposite – that the recent warming was much more significant than anything in the last millennium. Despite breaking their own selection rules for proxies, they managed to only demonstrate that the last decade of the last millennium the warmest by the narrowest of margins. See below.


There are many reasons to reject the paper (see here), but one significant point can be illustrated. There were only three reconstructions had any data prior to 1430. There were two tree ring studies from New Zealand, and coral study from Palmyra Atoll. Plotting the decadal averages shows that the erratic Palmyra data suppresses the medieval period and exaggerates the late twentieth century warming. Further, Palmyra Atoll is over 2000 km outside the study area.


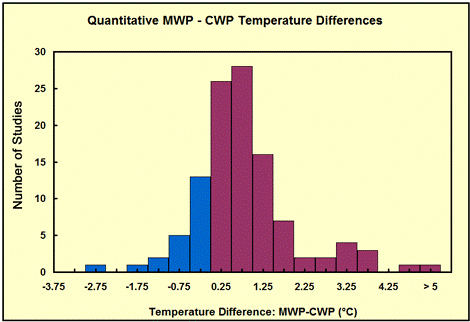
Finally, CO2Science.org specialises in accumulating evidence of the impacts of CO2. It also has a database of studies on the medieval warm period. There is a graph that summarizes the quantitative studies


Figure Description: The distribution, in 0.5°C increments, of Level 1 Studies that allow one

to identify the degree by which peak Medieval Warm Period temperatures either exceeded

(positive values, red) or fell short of (negative values, blue) peak Current Warm Period

temperatures.

In conclusion, on the face of it, there is very weak support for human emissions being the cause of most of the warming in the last century by the fact that changes in human emissions do not appear to move in line with changes in temperature. The case is further weakened by evidence that at times in the last 2000 years were warmer than in the current period. It does not discount the possibility that human emissions are responsible for some of the warming. But demonstrating that empirically would mean understanding and accurately measuring the full extent of the natural processes, then demonstrating that these were not operating as strongly as in previous epochs. By definition, the evidence will be more circumstantial than if there was a direct correlation. Furthermore, the larger the actual human impact the more circumstantial will be the evidence.

Rignot et al 2011 on ice sheet melt acceleration – reconciling with sea level rise

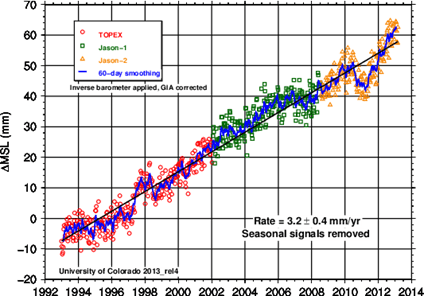
In this posting I will look at Rignot et al 2011 and compare with the University of Colorado “official” level figures.

The basic conclusions are

  1. Rignot et al 2011 estimate that over an 18 year period the acceleration in polar ice melt contribution around 1.8mm extra to annual sea level rise that either stayed constant at 3.2mm, or showed a slight decline. Examination of the Rignot figures suggests this result is a bit too neat.
  2. Although that acceleration in ice melt are not reflected in average long-term rise, large short-term variations ice-melt in the rate of ice melt do show up in swings in the rate of sea level rise two or three years later. In fact using an 11 month moving average sea level rise, the fit on some of those changes in sea levels are almost a mirror image of that rise.
  3. The mirrored similarities between the graphs would be improved by removing the acceleration trend in the ice-melt.
  4. When I measure the magnitude of the swings in the sea levels they are six to eight times greater than the expected 1mm rise from 365 billion tonnes of water. Considering possible errors makes the problem worse and would reduce the similarities between the two graphs.

This is where I need people to critically review the figures. Point 1 I believe is beyond doubt. Points 2 and 3 are easy to replicate if you have something like Excel 2010 where you can ghost one graph over another. But on point 4 I have been scratching my head over for a couple of days now, and cannot see any way that will correct the figures in the right direction.

The Rignot Paper Abstract

Rignot et al 2011 et al says the following.

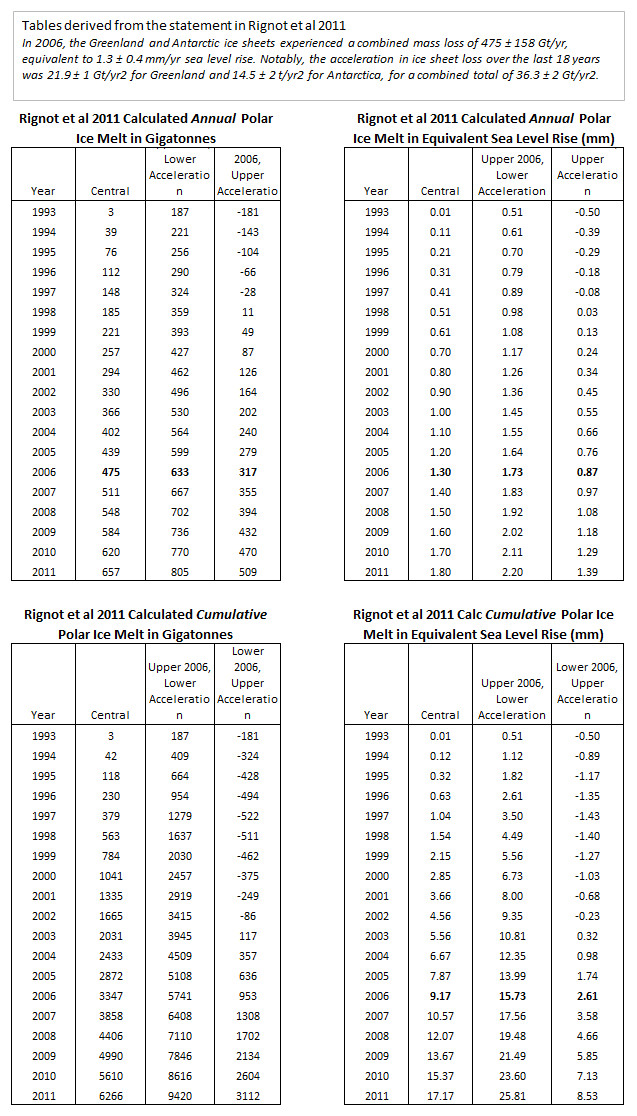
Ice sheet mass balance estimates have improved substantially in recent years using a variety of techniques, over different time periods, and at various levels of spatial detail. Considerable disparity remains between these estimates due to the inherent uncertainties of each method, the lack of detailed comparison between independent estimates, and the effect of temporal modulations in ice sheet surface mass balance. Here, we present a consistent record of mass balance for the Greenland and Antarctic ice sheets over the past two decades, validated by the comparison of two independent techniques over the last 8 years: one differencing perimeter loss from net accumulation, and one using a dense time series of time variable gravity. We find excellent agreement between the two techniques for absolute mass loss and acceleration of mass loss. In 2006, the Greenland and Antarctic ice sheets experienced a combined mass loss of 475 ± 158 Gt/yr, equivalent to 1.3 ± 0.4 mm/yr sea level rise. Notably, the acceleration in ice sheet loss over the last 18 years was 21.9 ± 1 Gt/yr2 for Greenland and 14.5 ± 2 Gt/yr2 for Antarctica, for a combined total of 36.3 ± 2 Gt/yr2. This acceleration is 3 times larger than for mountain glaciers and ice caps (12 ± 6 Gt/yr2). If this trend continues, ice sheets will be the dominant contributor to sea level rise in the 21st century.

In 2006 combined mass loss was 475 billion tonnes, sufficient to raise sea levels 1.3mm. This gives 365 billion tonnes to raise sea levels by 1mm, something that I have verified in other studies. So the paper estimates the sea level rise from Greenland and Antarctic ice sheets mass loss is accelerating by 0.1mm per annum. The authors also claim that from mountain glaciers and ice caps there is a further 0.033mm of acceleration. Multiply that by 18 years means melting ice must be raising sea levels in 2011 by around 2.4mm more than in 1993. We can also backtrack to when the start point of net ice melt by deducting 36.3 from yearly figure. In 1993, the first year of the study, ice melt comes to 3.1 billion tonnes. That is effectively zero.

Further, the 2006 ice mass loss has a calculated uncertainty figure at 158 is quite large. To the nearest whole number it is exactly one-third of 475 central ice-mass loss figure. From this we can then calculate the upper and lower uncertainty bands on the contribution to sea level rise in 1993. The upper band is to assume the highest figure for 2006 (+475+158) and the lowest acceleration (+36.3-2). The lower band is to assume the lowest figure for 2006 (+475-158) and the highest acceleration (+36.3+2).

I have put the results in giga tonnes, and equivalent sea level rise into a couple of tables below.

Rignot2011 implied polar ice melt

The whole structure of figures seems somewhat contrived. However, it does not mean that the figures are outside of the bounds of what could be actually happening. To assess that we must look to the seasonally adjusted sea level rise figures from the University of Colorado.


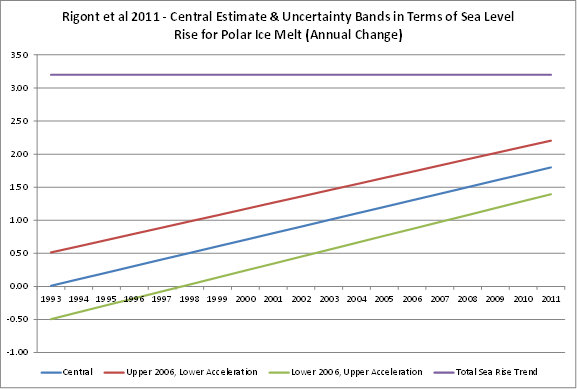
At this stage, the point to note is the trend line. Since the first satellite data in 1993, sea levels have been rising at about 3.2 mm per year. This I have plotted against the modelled contribution from Rignot.


If you add in the contribution from mountain glaciers and ice caps, in 18 years ice melt is alleged to have increased from 0% to 75% of the sea level rise trend in that period. That does not stack up. A model that fits so conveniently into the study period and nicely rounds to sea level rise equivalents, shows a trend that is completely out of line with the sea level rise.

To probe further, I downloaded the sea level data figures from the University of Colorado.

Replicating the Colorado Sea Level Rise graph

From the website I downloaded the seasonally adjusted figures, as that is what Rignot had used for ice melt.

I only use Excel, not the R statistical package like proper statisticians use. So I had to simplify the data. Please bear with me, as my “dumb” analysis still yields some very interesting results in the next section.

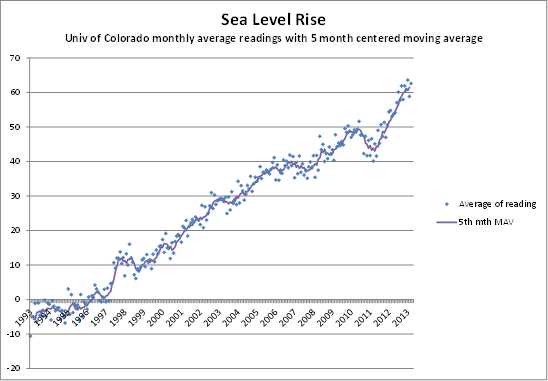
There are currently 710 lines of data, of which the first is “1992.9595 -5.800“. Each data point has a date and a value. The four places of decimals enable not only the actual day, but even the hour do be identified. As such, if readings are irregularly spaced, it will not bias the analysis, despite there only being about three readings a month, or one every ten days. I split the data into calendar months by first multiplying the decimal by days in the year and doing a lookup from here. I then took the average value per month. I know that February is likely to be under represented, by with 245 months of data, it will not make much of a difference to the general picture.

To validate this, I created a simplified version of the cumulative sea level rise graph. It still shows a cumulative rise of 64mm in 20 years. It shows the data points and a 5 month centred moving average.


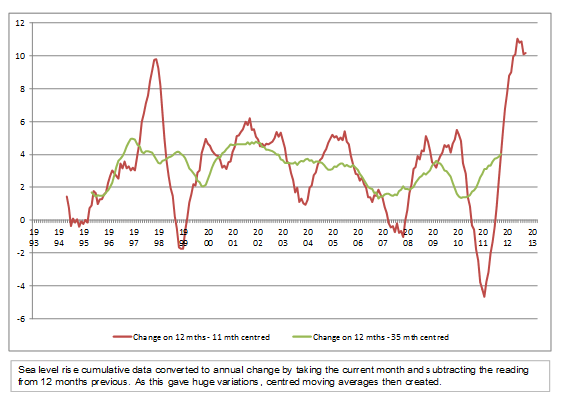
The problem with the graph is that it visually under represents significant short term fluctuations. The rise in the last twelve months is obtained by subtracting figure from 12 months previous from the current month. This generated some enormous fluctuations. I therefore created 11 month and 35 month centred moving averages.


Even though smoothed, there are some pretty large fluctuations in the rate of sea level rise, particularly in 1997 to 2000 and after the start of 2010.

The 35 month centred is much smoother and it is possible to see a distinct decline from 2001 to 2007 by more than 50%.

Rignot graph compared

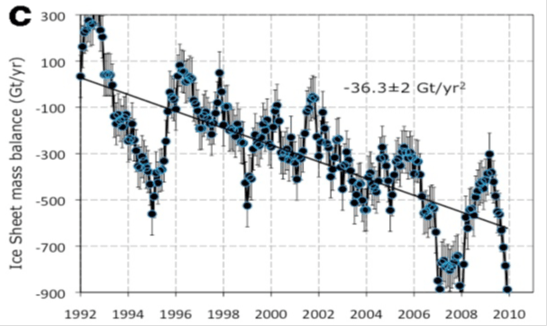
The Rignot et al 2011 paper posts three nice graphs of estimated ice losses. There are separate ones for Greenland and Antarctica, then a combined graph. It is this graph C that I reproduce below.


The annualised rate takes each month reading and multiplies by 12. So change is exaggerated?

My graph smooth the peaks, as it is a moving average. However, the Rognot graph appears to be almost a mirror of the sea level rise 11-month centred, except ice mass balance has a slope. For instance

  • Rognot has a peak of ice loss around the end of 1994, with an opposite peak of ice gain by a low at the end of 1994. The rate of sea level rise peaked in early 1996, followed by sharp change to small decline in sea levels at the end of 1998.
  • Rognot has a peak of ice loss at the end of 2007, with an opposite low in ice loss in early 2009. The rate of sea level rise peaked in early in late 2009, followed by sharp change to significant decline in sea levels in early 2012.

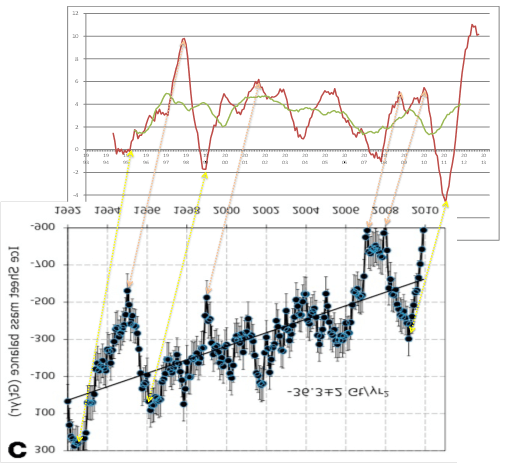
The peaks and troughs are so similar I flipped over the Rignot graph and aligned it up with rate of sea level rise graph.


Not only do major turning points correspond, but whole sections as well. The delay in the ice sheet melt is reflected in sea rise about 20 to 36 months after, so it not that exact. Also, a much better fit would be obtained if Rignot had not built in a slope in the graph. It seems the acceleration is anomalous.

I have uploaded a file here that contains the images. In Excel try moving the upper image over the lower one, without releasing. I have also included another graph with a centred 13 month moving average. It obtains similar results. It seems that in Rignot et al polar ice melt model (modified for slope) would appear to be an excellent short-run predictive model of the rate sea level rise.

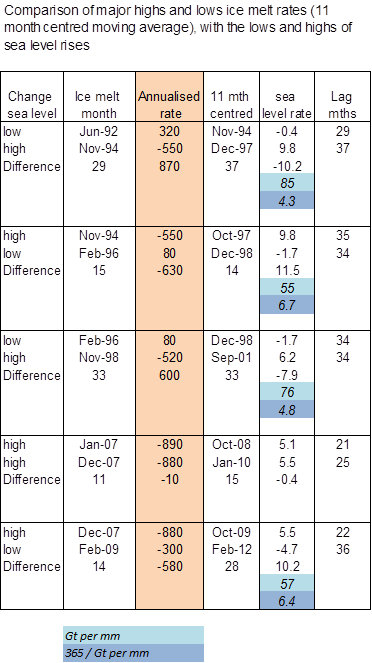
There is a slight snag with my numbers. Before doing the above comparison, I looked at various movements between high and low points.


I have had to estimate the sea ice changes and dates of changes from the graph. In light blue is the number of gigatonnes of ice/water that is apparently needed to raise see levels by 1mm. The figure in deeper blue is how many times more effective Rignot ice melt appears to be in raising sea levels. I cannot see where I have made an error in this table. Or, at least, everything I can think of makes the problem worse. Here are some possibilities.

  1. Annualised data on ice-melt. Each monthly figure is multiplied by twelve. But smoothing would not only make the movements less of a fit between graphs but would exaggerate the problem.
  2. Moving average figure for sea level rise. But de-smoothing would not only make the movements less of a fit between graphs but would exaggerate the problem. Further, I would expect a lagged response to smudge the sharpness of the initial impulse, not make it more acute.

Please look at the figures carefully, as there is bound to be an issue. After all, one (slightly) manic beancounter is more likely to be wrong that four leading experts in their field.

Kevin Marshall

NB. I have comment moderation set for anyone who has not previously commented. If you would like to contact, but do not wish publication, please use the comments, making this clear. I will respect any non-threatening request.

Rignot, E., I. Velicogna, M. R. van den Broeke, A. Monaghan, and J. Lenaerts (2011), Acceleration of the contribution of the Greenland and Antarctic ice sheets to sea level rise, Geophys. Res. Lett., 38, L05503, doi:10.1029/2011GL046583.,

Financial costs of Fulcrum Power’s Green Diesel Plant

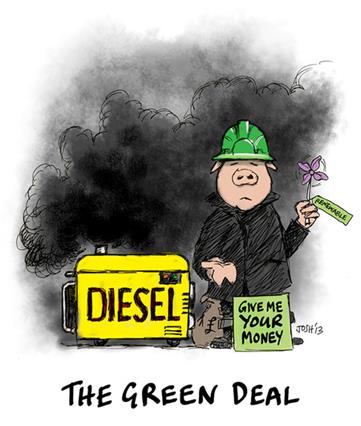
The BBC reports on a planning application submitted by Fulcrum Power to Plymouth Council to build a 20 MW diesel engine power station. This plant will operate backup for when renewables energy fails – mostly in the form of the wind failing to blow in the cold weather. Bishop Hill is, rightly, quite scathing because the diesel power is required to backup so-called green solutions. Josh weighs in with a cartoon


My posting is on the scandalous cost of this backup power station.

(Links are at the foot of the posting)

The BBC says

The application by Fulcrum Power is for a 20 megawatt (MW) Stor (Short Term Operating Reserve) power station on the former Toshiba plant at Ernesettle Lane, which company bosses said would cost “several million pounds”.

Its 52 generators will consume more than 1.1m litres of diesel a year, or about one tanker a week.

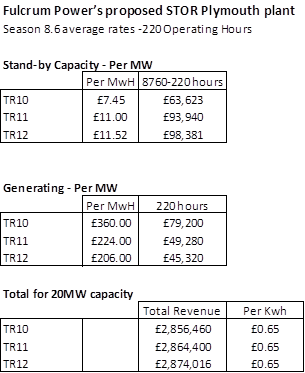
A litre of diesel with generate around 4kwh hours of electricity. (The normal measure is grams/kwh. A small diesel generator uses about 200 g/kwh and the RD of diesel is about 0.83 from memory). A 20 MW power station will therefore consume about 5,000 litres an hour of fuel. 1.1m litres will be consumed in just 220 hours, which means the plant is expected to operate for the equivalent of full power for just 2.5% of the hours in a year.

These companies will be paid a backup fee by the National Grid and then a rate per kwh generated. For this calculation I will look at just the cost per kwh. The fuel cost is easy. Diesel currently costs about £0.60 a litre, so that is £0.15 per kwh or 50% more than what I paid on my last electricity bill.

I tried to do some quick estimates and believe that the operating costs and cost of capital on “several million pounds” would be as much again. Being a little more curious, I did a search and found the “National Grid STOR Market Information Report No.19” on the National Grid’s Website. There is a bidding process every couple of months for Short Term Operating Reserve (STOR) capacity. Within the report is published the average winning and rejected bid rates. The most recent was season 8.6. As expected the bid is in two parts. First, a standby rate and second a (much higher) generating rate. There are bands, with the lower the standby rate, the higher the generating rate. I plugged the values into Excel and found that on all three rates Fulcrum Power could receive the equivalent of £0.65 Kwh. Gross Revenue would be around £2.86m. Deducting the cost of 1.1m litres for diesel leaves a contribution of £2.2m. There is probably a few hundred thousand of fixed costs, but payback on “several million pounds” looks to be pretty quick.


I have also done a check on other operating hours, shown below. The average in 2011-12 for STOR capacity was nearer 50 hours. At this level the revenue is much lower and more varied – from £1.66m to £2.12m. Dropping to just 5 hours per year still gives £1.34m to £2.04m.

Kevin Marshall

BBC Report

Fulcrum Planning Application

Bishop Hill blog report

Josh Cartoon

Cartoons by Josh

Fulcrum Power

National Grid STOR

National Grid STOR Market Information Report No.19


Ed Davey’s anti-science, anti-British and anti-Liberal attack on Climate Sceptics

Ed Davey, Secretary of State for Climate and Energy has, according to the Telegraph recently said

“Of course there will always be uncertainties within climate science and the need for research to continue.

I agree that there are uncertainties with climate science. But if you only allow believers in that “science” to contribute, without any training in decision-making under conditions of uncertainty, then the conclusions drawn out of that research will be wrong.

“But some sections of the press are giving an uncritical campaigning platform to individuals and lobby groups,”

Such as the Guardian, the BBC, or central government departments? It can work both ways.

“This is not the serious science of challenging, checking and probing.”

Are you speaking of sceptics or of climatology? You must first establish that climatology is not just a science, but is a science of the highest standards.

“This is destructive and loudly clamouring scepticism born of vested interest, nimbyism, publicity seeking contraversialism or sheer blinkered, dogmatic, political bloody-mindedness.”

Matthew 7:3-5 says

Why do you stare at the splinter in your neighbour’s eye, but ignore the plank in your own? How can you say to your neighbour “Here – let me get the splinter out of your eye,” when you’ve got the plank in your own? You’re just play-acting! First take the plank out of your own eye, then you’ll see clearly to take the splinter out of your neighbour’s eye.”

These two thousand year old words, translated by Tom Wright (Britain’s leading New Testament Scholar and former Bishop of Durham), show the issue of climatology. Professor Stephan Lewandowsky or Bob Ward, or desmogblog are some of the “planks” that deliberately blind and prejudice people from examining the evidence, moral and political arguments for themselves. Putting in a milder fashion, you cannot say that people are wrong, or have a massively inferior argument, if you cannot first demonstrate that you are on the side of truth, or encourage others compare and contrast your arguments with the opponents. As I posted last week, there is a strong lack of a positive case for the science. As I posted last week, this should be a combination of trumpeting the short-term predictive successes, showing that climate science build on the traditions of the greatest scientists and philosophies of science and also of the moral case covered below.

“This tendency will seize upon the normal expression of scientific uncertainty and portray it as proof that all climate change policy is hopelessly misguided.”

Rubbish. Criticism of policy is often for separate reasons to scientific uncertainty. The argument is that the costs of policy are far greater than then benefits. Some of the policy might be totally ineffective, or in trying to reduce CO2 emissions may make people less capable of dealing with the impacts, through making them poorer.

He added: “By selectively misreading the evidence, they seek to suggest that climate change has stopped so we can all relax and burn all the dirty fuel we want without a care.”

Sceptics say that climatologists selectively read the evidence. Many would say that increased CO2 provides net benefits, and I do not come across any blog that we should create general pollution without a care. Many of the leading sceptic blogs (WUWT, BishopHill, Jo Nova) accept that increased greenhouse gases will lead to some level of warming, but not a significant one. As put by Warren Meyer, most sceptics deny the catastrophe, not the basic science.

“Those who argue against all the actions we are taking to reduce emissions, without any serious and viable alternative, are asking us to take a massive gamble with the planet our children will inherit, in the face of all the evidence, against overwhelming odds.”

I believe that morally politicians should act like medical professionals. They should have a duty of care towards the patient. That duty should be based on the reasonable expectation that treatment will leave the patient better off than not being treated at all. If anyone claims that climatology and public-policy making have the same level of knowledge of diagnosis and treatment as medical professionals and pharmacy on such ailments as common cancers or arthritis, then they are wrong. I would say that climate “ethics” needs to catch up with medical ethics as well.

Finally, let me point to four areas where Ed Davey is severely out of line.

First, my late father voted for the Liberal Party for over 50 years at every election – bar at one local election where no Liberal was standing. Then he voted for the underdog Conservative candidate. He believed in the consensus through seeking the middle ground, a thoroughly British trait. This middle ground was the opposite of the extremism of climatology, which is increasingly about demeaning the opposition and denying them a platform to speak.

Second, a virtue of English Common Law is that of letting the accused have the same rights of presentation, and to have the same rules of evidence as for the prosecution. This is not in the belief that the most notorious criminals can get off scot free. It is because the most guilty who proclaim their innocence will most convince an independent jury of their guilt as their lies and ridiculous stories unravel. On the other side, if the prosecution, convinced of the guilt of the accused perverts or supresses the evidence, the later unravelling of the case will undermine the rule of law. It did with the Guildford Four and the Birmingham Six, men falsely sentenced for heinous crimes that they did not commit. Another example is that I strongly believe that those who do not accept that around six million Jews were massacred in the Nazi genocide should not be silenced. Rather, comparing their evidence will the overwhelming evidence of the historical truth will demonstrated that there is no debate, and those deniers are have an inability to assess the evidence. Silencing such views will lead to false conspiracy theories that there is something to hide.

Third, is the British sense of fair play. The very British idea of having a level playing field is not unconnected to the fact that most major sports are British inventions, or have been strongly influenced by British rule-making. Winning is not at any cost is not the point. It is playing the game to the best of one’s ability. There is a lesson in life as well. Somebody might be far superior in a sport, or in science, or in any intellectual field, than anyone else alive. But it is only by going head-to-head with others that everyone will be convinced. But in losing in sport, we go back and try harder. If we are beaten in science, we are forced to re-examine our conclusions, and may improve. Finding out where we went wrong, or how to improve from failures is a general lesson in life. Within wider society it leads to improvement.

Fourth is something very anti-British. The most evil powers, whether governments, religious cults or tribal gangs, are those who assert their power by belittling and silencing others. Ed Davey and climatologists are not in their league by any means. But they fall into a false sense of superiority by demeaning others. It is a very human trait to practice this, but has mostly held back humanity.

The previous Secretary of State, Chris Huhne, earlier this year convicted of perverting the course of justice, was similarly dogmatic. Why there should be two ministers so at odds with the older philosophy of the moderate Liberal Party traditions is the subject of the next post.

Lamar Smith and Implementing effective policy on climate change

There has been considerable ire directed at Texan Congressman Lamar Smith for his Washington Post Op-Ed entitled “Overheated rhetoric on climate change doesn’t make for good policies”


Lamar begins

Climate change is an issue that needs to be discussed thoughtfully and objectively. Unfortunately, claims that distort the facts hinder the legitimate evaluation of policy options

Lamar concludes

Instead of pursuing heavy-handed regulations that imperil U.S. jobs and send jobs (and their emissions) overseas, we should take a step back from the unfounded claims of impending catastrophe and think critically about the challenge before us. Designing an appropriate public policy response to this challenge will require that we fully assess the facts and the uncertainties surrounding this issue, and that we set aside the hyped rhetoric.

I could not agree more. Judith Curry shows that the so-called “scientific” criticism is less balanced than the politician’s initial comments.

To think critically and objectively about any complex problem, it needs to be broken down into sub-sections with relevant areas of expertise. This is no more important in climate change policy, which science demands belief and people get lost in irrelevant detail. A starting point is to divide the issue into three parts, with the relevant experts in brackets.

1. Whether there is a potential problem. (Scientists)

2. Whether that potential problem is non-trivial. (Economists interpreting the scientists work)

3. Whether there is the ability to do something positive about that problem. (Economists and public policy-makers to formulate any policy. Economist/auditors, with some input from scientists, to interpret the results.)

1. Whether there is a potential problem.

The potential problem most would accept. Increase the level of greenhouse gases and average temperatures goes increase. It actually folds into the second.

2. Whether that potential problem is non-trivial.

But the second is far more important. The starting point to see if the size of the problem, it to break any potential impacts down into the components of magnitude, likelihood, time for changes to occur and the weighting that can be given to the scientific evidence. This is discussed here. Like in many other areas, the weighting we give to expert opinion should be based on a track record. Climate science is still very much in its infancy and many of the projected signposts were either wrong (worsening storms, accelerating sea level rises) or much too extreme (temperature rises). In fact any alleged successes are either through luck or through the initial prediction being so vague that it could hardly fail to be correct. There should also be a recognition concerning any potential benefits. For instance, Scotland would benefit from being a tad warmer, and increased CO2 may help plant growth. There is also a question of the quality of the climate model projections. There seems little or attempt at quality improvement through learning from past mistakes and building on successes. Further I see plenty of claims of being on the side of peer-reviewed science, and on consensus, whilst have a huge public-relations effort but little about building on the traditions of the greatest scientists, or learning from the philosophers of science. “Climate Science” seems somewhat out of that mainstream.

3. Whether there is the ability to do something positive about that problem.

The third is where the policy-makers step in. Are they able to deliver a policy that will tackle the issues at a lower costs than the benefits? To give a medical analogy, have they sufficient qualifications and the moral duty of care, that where they inflict painful treatments, the patient (the human race and/or Mother Gaia) is better off than if they had done nothing. Given the massive policy failures so far, the answer seems highly negative. Given that much of the effort is going into shutting down and policy discussion by believers in the science and in the policy, failures seem set to continue through deliberate negligence of this issue.

To take the medical analogy further, treatment is tempered by the uniqueness of the ailment and the track record in treating that ailment. For instance hip replacements have been performed for many years and are quite frequent, so the risks and pain of treatment, along with the mortality rates are known. So an otherwise reasonably healthy person of forty whose hip joints need replacing to enable them to walk would be recommended for the operation. A frail ninety year old would not. But we have never had human-caused climate change before. Indeed, there is a huge dispute about how serious the symptoms will actually be. They have not come to fruition just yet. Furthermore the “treatment” has not been properly tested. Neither have those devising the treatment any sort of qualifications or track record in devising similar treatments. Why do I know this? Because there has never been a global initiative to use economic tools to drive through a solution to a problem whose outward characteristics (though not necessarily the causes) are a naturally-occurring phenomena, neither are involved people who have experience is getting consensus on global issues, such as nuclear non-proliferation.

Note on the Moral View

I have a strong moral view that politicians should act to make the world a better place, as the underlying desired outcome of public service. It can be on the world stage or in a local community. Climate policy means imposing costs now to avoid much higher costs later. It might be a simplistic and naïve view, but the opposite – that politicians work to make a net negative impact, or do not care what effect they have, or simply work to serve some small factional interest (and to hell with everybody else) – are views that are at least distasteful and at worst downright evil. Like a medical professional, they have a duty of care to make sure there is a reasonable expectation that net positive outcomes will happen, and to monitor that progress.

Kevin Marshall

Abused Women and Claims of Climate Consensus

Steven Goddard, in explaining why women consistently show stronger support for President Obama than men, comments.

Many people with feminine personalities fall into co-dependency, and are satisfied by ridiculous lies in a thoroughly abusive relationship.

That is a bit strong. In modern terminology, women tend to network more than men. In older terminology, they like to gossip and form opinions on the basis on their social interactions. Such characteristics help hold social units together, but do make women more prone to being won over by emotive arguments that males.

But women in abusive relationships have very low self-esteem being continually told that they are inferior. The men in their lives tell them that their opinion does not count. Any signs of questioning are rebutted verbally, emotionally and physically. The greatest abusers tend to be the biggest liars and the most emotionally inadequate. In more traditional, male-dominated communities such abusers claim legitimacy from that society for practices (such as adultery) that it would not condone. Unfortunately the traditional male-dominated churches have used alleged biblical authority to support the male-abusers in marriage, and even to excuse or down-play paedophilia.

In terms of climatology, claims of superiority of climate scientists have some parallels with these abusing and hate-filled men. Supporters of climate consensus claim that deniers are psychologically inferior and totally incapable of understanding the world around them. They stamp down on any dissent with spurious reasons, such as alleged funding by big oil, yet do not admit to their own funding, nor (and far more dangerously) their own very dogmatic belief systems. They claim the authority of science, but never define what science is, nor how their dogma fits into the best traditions of science.

There are increasing exceptions to the feminine submissiveness. The late Margaret Thatcher is the most extreme. She had a strong sense of values and phenomenal determination to pursue those values. But Thatcher also considered and vigorously questioned any briefings before making decisions. If a case could be made she would change her mind. This may in part be due to a traditional training in science. It is part also due to a feminine side of empathy with opposing points of view.

This feminine trait of talking to other people and listening to different views might explain why although all sides of the climate argument are dominated by men, the most prominent climate bloggers women are sceptical. This includes Joanne Nova, Donna Laframboise, Judith Curry and Lucia. Before someone points out some women alarmists blogs, their respective Alexa rankings are currently 149873, 883955, 393802 and 619501.

Green Energy Unicorns

It is not just sufficient to diagnose a problem and get some noisy activists to think up a solution. It is not even sufficient to get some of the greatest economists to devise the theoretically ideal policy. It is also necessary to drive that policy through to a conclusion. Donna Laframboise provides a catalogue of recent green energy failures. It is far from being an exhaustive list, but it amply illustrates that even if we are facing an imminent climate apocalypse, these green policies are not only useless, they are making us poorer, and thus making the situation worse.

Donna Laframboise's avatarBig Picture News, Informed Analysis

Everywhere it has been tried, green energy is costly, unreliable & financially unsustainable over the long term. Here’s a reading list for those still in doubt.

I’ve recently been writing about the fossil fuel divestment movement which, according to someaccounts, is “sweeping” US college campuses. In the opinion of the idealistic young activists involved in this movement, fossil fuels are passé.

“It’s time for a new age of renewables” they declare. College endowment funds should invest in “renewable energies” instead.

Why do we hold on so firmly to green fantasies? Why won’t we admit that currently available renewable energy sources don’t measure up?

This past March, the chief investment officer for California’s state pension plan called investments in clean technology “a noble way to lose money.” It’s possible, he acknowledged, that some of these investments might turn out to be profitable on a timescale of…

View original post 694 more words