Whilst Anthony Watts was speaking on the Climate Realism show, the main screen was scrolling through the Environmental Defense Fund (EDF) and the Union of Concerned Scientists (UCS) “COMPLAINT FOR DECLARATORY, INJUNCTIVE, AND MANDAMUS RELIEF” document. Part of Paragraph 27 stood out.
EPA’s final finding rested on a vast body of rigorous, peer-reviewed scientific research confirming that greenhouse gas pollution is driving destructive changes in our climate that pose a grave and growing threat to Americans’ health, security, and economic well-being.
Let us follow the “Consensus Science” on this one. Hansen et al. 1988 (the paper behind the 1988 staged event that really launched the global climate hysteria), states that greenhouse gases are well-mixed. That means it does not matter where in the world anthropogenic emissions originate; each unit of these trace gases affects the levels in equal measure. Capitalist countries do not emit a more pernicious form of CO2 than, say, communist ones. Yet, International law related to climate is written as if this were the case. A detailed exposition of that international law is contained in a recently issued Judgement by the International Court of Justice, “OBLIGATIONS OF STATES IN RESPECT OF CLIMATE CHANGE“. Paragraph 179 states
The principle of common but differentiated responsibilities and respective capabilities is a cardinal principle of the climate change treaty framework, which is incorporated in several provisions of the climate change treaties (see UNFCCC, preamble, Article 3, paragraphs 1 and 2, and Article 4; Kyoto Protocol, Article 10; Paris Agreement, Article 2, paragraph 2, and Article 4, paragraphs 3, 4 and 19; see also paragraphs 148-151 above)……
What does “the principle of common but differentiated responsibilities” mean? This is spelt out in the UN Framework Convention on Climate Change (UNFCCC) 1994 Article 4.7
The extent to which developing country Parties will effectively implement their commitments under the Convention … will take fully into account that economic and social development and poverty eradication are the first and overriding priorities of the developing country Parties.
Developed country Parties should continue taking the lead by undertaking economy-wide absolute emission reduction targets. Developing country Parties should continue enhancing their mitigation efforts, and are encouraged to move over time towards economy-wide emission reduction or limitation targets in the light of different national circumstances.
That is, under UN law, there is a two-track approach to cutting emissions. Only developed Western countries have an obligation to cut their emissions in the near future. The rest of the world following on at a some yet to be agreed upon point in the future. The idea of a unified global approach to emissions reductions are an illusion in the mind of climate activists. Therefore, net zero policies, or talk of achieving following some 1.5 °C and 2 °C emissions pathways are just narratives to impose costly and pretty much useless policies on a few countries.
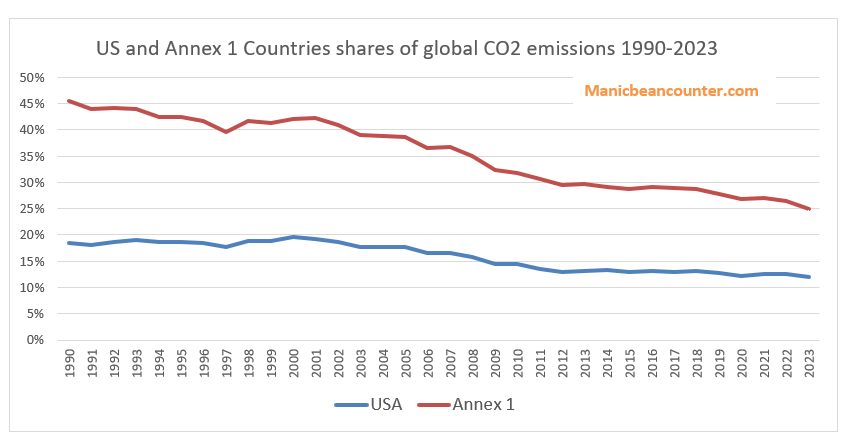
How has this played out? Under the UNFCCC Treaty, the developed (or Annex 1) countries include the more developed parts of the former Soviet Union. But Russia, Belarus and Ukraine have been temporarily excluded for the last 30+ years as “economies in transition”. That leaves the USA, EU, Japan, Canada, Australia and UK as the main radical emissions-cutting countries, along with Mexico and Türkiye, whose emissions have massively increased since 1990. How does that work out? US CO2 Emissions declined 3% from 1990-2023, but have declined as a share of the global total from 18.5% to 12.0%. The share declined due to CO2 emissions in the “developing countries” increasing during 1990-2023 by 105%. In other words, now seven-eighths of the CO2 “pollution” affecting Americans emanates from outside the USA. Further, the EPA endangerment finding covers just a part of the national policies. These consensus scientists should realise that the EPA Endangerment Finding is severely limited territorially. If policy is evaluated from the standpoint of achievable goals, then any emissions constraint policy by the US in whole or in part that aims to stop “climate change” will fail.
Figure 1 : US and Annex 1 Countries’ shares of global CO2 emissions 1990-2023. Source : Global Carbon Budget – Sum of “Territorial” CO2 emissions (mostly fossil fuel emissions) and “Land-use Changes”.
If a fantasy is something impossible, or highly improbable, then I believe that I more than justify the claim concerning the latest BP Energy Outlook. A lot of ground will be covered but will be summarised at the end.
Trigger warning. For those who really believe that current climate policies are about saving the planet, please exit now.
The BP Energy Outlook 2023 was published on 26th June. From the introduction
Energy Outlook 2023 is focused on three main scenarios: Accelerated, Net Zero and New Momentum. These scenarios are not predictions of what is likely to happen or what BP would like to happen. Rather they explore the possible implications of different judgements and assumptions concerning the nature of the energy transition and the uncertainties around those judgements.
One might assume that the order is some sort of ascent, or decent. That is not the case, as New Momentum is the least difficult to achieve, then Accelerated, with Net Zero being the hardest to achieve. The most extreme case is Net Zero. Is this in line with what is known as Net Zero in the UNFCCC COP process? From the UNEP Emissions Gap Report 2018 Executive Summary, major point 2
Global greenhouse gas emissions show no signs of peaking. Global CO2 emissions from energy and industry increased in 2017, following a three-year period of stabilization. Total annual greenhouse gases emissions, including from land-use change, reached a record high of 53.5 GtCO2e in 2017, an increase of 0.7 GtCO2e compared with 2016. In contrast, global GHG emissions in 2030 need to be approximately 25 percent and 55 percent lower than in 2017 to put the world on a least-cost pathway to limiting global warming to 2°C and 1.5°C respectively.
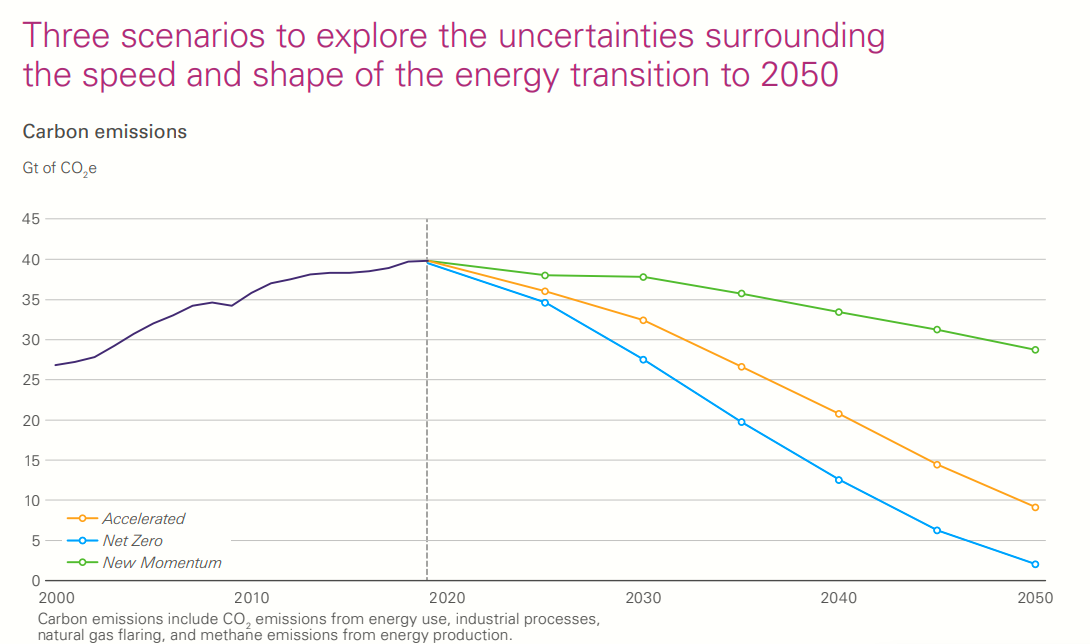
With Net Zero being accomplished for 2°C in 2070 and 1.5°C in 2050, this gives 20 years of 2017 emissions from 2020 for 2°C of warming and just 12 years for 1.5°C. Figure 1 in the BP Energy Outlook 2023 Report, reproduced below, is roughly midway between 12 and 20 years of emissions, although with only about three-quarters of the emissions, in equivalent CO2 tonnes that the UN uses for policy. This seems quite reasonable course to take to keep things simple.
The BP Energy Outlook summarises the emissions pathways in a key chart, reproduced below.
Fig 1 : BP Energy Outlook 2023 scenario projections, with historical emissions up to 2019
One would expect the least onerous scenario would be based on current trends. The description says otherwise.
New Momentum is designed to capture the broad trajectory along which the global energy system is currently travelling. It places weight on the marked increase in global ambition for decarbonization in recent years, as well as on the manner and speed of decarbonization seen over the recent past. CO2e emissions in New Momentum peak in the 2020s and by 2050 are around 30% below 2019 levels.
That is the most realistic scenario based on current global policies is still based on a change in actual policies. How much though? Fig 1 above, shows, actual emissions up to 2019 are increasing, then a decrease in all three scenarios from 2020 onwards.
At Notalotofpeopleknowthat, in an article on this report, the slightly narrower CO2 emissions narrow CO2 emissions are shown.
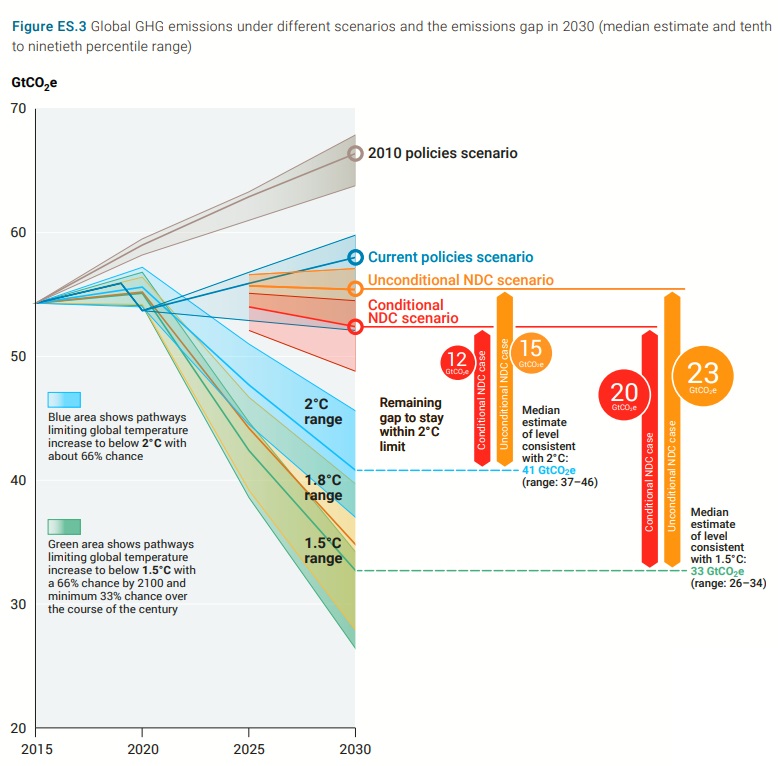
There was a significant drop in emissions in 2020 due to covid lockdowns, but emissions more than recovered to break new records in 2022. But all scenarios in Fig 1 show a decline in emissions from 2019 to 2025. Neither do emissions show signs of peaking? The UNEP Emissions GAP Report 2022 forecasts that GHG emissions (the broadest measure of emissions) could be up to 9% higher than in 2017, with a near zero chance of being the same. The key emissions gap chart is reproduced in Fig 3.
Fig 3. Emissions gap chart ES.3 from UNEP Emissions Gap Report 2022
Clearly under current policies global GHG emissions will rise this decade. The “new momentum” was nowhere in sight last October, nor was there any sight of emissions peaking after COP27 at Sharm el-Sheikh in December. Nor is there any real prospect of that happening at COP28 in United Arab Emirates (an oil state) later this year.
Yet even this chart is flawed. The 2°C main target for 2030 is 41 GtCO2e and the 1.5°C main target is 33 GtCO2e. Both are not centred in their ranges. From the EGR 2018, a 25% reduction on 53.5 is 40, and a 55% reduction 24. But at least there is some pretence of trying to reconcile desired policy with the most probable reality.
It gets worse…
In the lead-up to COP21 Paris 2015 countries submitted “Intended Nationally Determined Contributions” (INDCs). The UNFCCC said thank you and filed them. There appears to be no review or rejection of any INDCs that clearly violated the global objective of substantially reducing global greenhouse gas emissions by 2030. Thus an INDC was not rejected in the contribution was highly negative. That is if the target implied massively increasing emissions. The major example of this is China. Their top targets of peaking CO2 emissions around 2030 & “to lower carbon dioxide emissions per unit of GDP by 60% to 65% from the 2005 level” (page 21) can be achieved even if emissions more than double between 2015 and 2030. This is simply based on the 1990-2010 GDP average growth of 10% and the emissions growth of 6%. Both India and Turkey (page 5) plan to double emissions in the same period. (page 5) and Pakistan to quadruple theirs (page 26). Iran plans to cut its emissions by 4% up to 2030 compared with a BAU scenario. Which is some sort of increase.
There are plenty of other non-OECD countries planning to increase their emissions. As of mid-2023 no major country seems to have reversed course. Why is this important? The answer lies in a combination of the Paris Agreement & the data
The flaw in the Paris Agreement
Although nearly every country has signed the Paris Agreement, few have understood its real lack of teeth in gaining reductions in global emissions. Article 4.1 states
In order to achieve the long-term temperature goal set out in Article 2, Parties aim to reach global peaking of greenhouse gas emissions as soon as possible, recognizing that peaking will take longer for developing country Parties, and to undertake rapid reductions thereafter in accordance with best available science, so as to achieve a balance between anthropogenic emissions by sources and removals by sinks of greenhouse gases in the second half of this century, on the basis of equity, and in the context of sustainable development and efforts to eradicate poverty.
The agreement lacks any firm commitments but does make a clear distinction between developed and developing countries. The latter countries have no obligation even to slow down emissions growth in the near future. Furthermore, the “developed” countries are quite small in population. These are basically all the members of the OECD. This includes some of the upper middle-income countries like Turkey, Costa Rica and Columbia, but excludes the small Gulf States with very high per capita incomes.
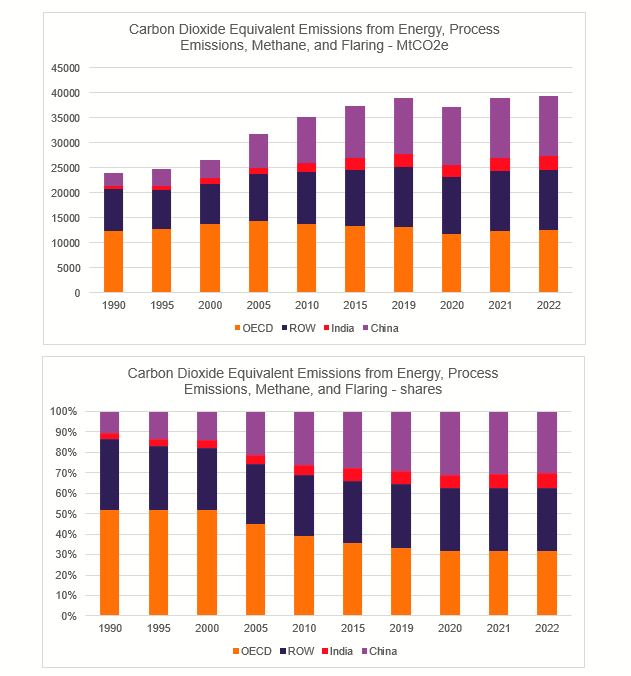
BP is perhaps better known for its annual Statistical Review of World Energy. The 2023 edition was published on the same day as the Energy Outlook but for the first time by the Energy Institute. From this, I have used the CO2 emissions data to split out the world emissions into four groups – OECD, China, India, and Rest of the World. The OECD countries collectively have a population of about 1.38bn, or about the same as India or China.
Fig 4: Global Emissions from the Energy Institute Statistical Review of World Energy 2023 shown in MtCO2e and shares.
From 1990 to 2022, OECD countries increased their emissions by 1%, India by 320%, China by 370% and ROW by 45%. As a result the OECD share of global emissions fell from 52% in 1990 to 32%. Even if all the non-OECD countries kept the emissions constant in the 2020s, the 2°C target could only be achieved by OECD countries reducing their emissions by nearly 80% and for the 1.5°C target by over 170%. The reality is that obtaining deep global emissions cuts are about as much fantasy as believing an Official Monster Raving Loony Party candidate could win a seat in the House of Commons. Their electoral record is here.
The forgotten element….
By 2050, we find that nearly 60 per cent of oil and fossil methane gas, and 90 per cent of coal must remain unextracted to keep within a 1.5 °C carbon budget.
Welsby, D., Price, J., Pye, S. et al. Unextractable fossil fuels in a 1.5 °C world. Nature597, 230–234 (2021).
It has been estimated that to have at least a 50 per cent chance of keeping warming below 2°C throughout the twenty-first century, the cumulative carbon emissions between 2011 and 2050 need to be limited to around 1,100 gigatonnes of carbon dioxide (Gt CO2). However, the greenhouse gas emissions contained in present estimates of global fossil fuel reserves are around three times higher than this, and so the unabated use of all current fossil fuel reserves is incompatible with a warming limit of 2°C
McGlade, C., Ekins, P. The geographical distribution of fossil fuels unused when limiting global warming to 2 °C. Nature517, 187–190 (2015).
I am not aware of any global agreement to keep most of the considerable reserves of fossil fuels in the ground. Yet is clear from these two papers that meeting climate objectives requires this. Of course, the authors of the BP Energy Outlook may not be aware of these papers. But they will be aware of the Statistical Review of World Energy. It has estimates of reserves for oil, gas, and coal. They have not been updated for two years, but there are around 50 years of gas & oil and well over 100 years of coal left. Once
Key points covered
Energy Outlook scenarios do not include an unchanged policy
All three scenarios show a decline between 2019 & 2025. 2022 actual emissions were higher than 2019.
In aggregate Paris climate commitments mean an increase emissions by 2030, something ignored by the scenarios.
The Paris Agreement exempts developing countries from even curbing their emissions growth in the near term. Accounting for virtually all the emissions growth since 1990 and around two-thirds of current emissions makes significantly reducing global emissions quite impossible.
Then totally bypassing the policy issue of keeping most of the available fossil fuels in the ground.
Given all the above labelling the BP Energy Outlook 2023 scenarios “fantasies” is quite mild. Even though they may be theoretically possible there is no general recognition of the policy constraints which would lead to action plans to overcome these constraints. But in the COP process and amongst activists around the world there is just a belief that proclaiming the need for policy will achieve a global transformation.
Researchers Naomi Oreskes and Geoffrey Supran were among those propping up the litigation, which seeks to hold Chevron responsible for the damage climate change has played on city infrastructure.
The link is to an Amicus Brief submitted by Dr. Naomi Oreskes, Dr. Geoffrey Supran, Dr. Robert Brulle, Dr. Justin Farrell, Dr. Benjamin Franta and Professor Stephan Lewandowsky. I looked at the Supran and Oreskes paper Assessing ExxonMobil’s Climate Change Communications (1977–2014) in a couple of posts back in September 2017. Professor Lewandowsky on probably gets more mentions on this blog than any other.
The Introduction starts with the following allegation against Chevron
At least fifty years ago, Defendants-Appellants (hereinafter, “Defendants”) had information from their own internal research, as well as from the international scientific community, that the unabated extraction, production, promotion, and sale of their fossil fuel products would result in material dangers to the public. Defendants failed to disclose this information or take steps to protect the public. They also acted affirmatively to conceal their knowledge and discredit climate science, running misleading nationwide marketing campaigns and funding junk science to manufacture uncertainty, in direct contradiction to their own research and the actions they themselves took to protect their assets from climate change impacts such as sea level rise.
This are pretty serious allegations to make against a major corporation, so I have been reading with great interest the Amicus Brief and started making notes. As an ardent climate sceptic, I started reading with trepidation. Maybe there would be starkly revealed to me the real truth of climate denial. Instead, it has made very entertaining reading. After a three thousand words of notes and having only got up to 1972 in the story, I have decided to break up the story into a few separate posts.
Edward Teller 1959
The Amicus Brief states
In 1959, physicist Edward Teller delivered the first warning of the dangers of global warming to the petroleum industry, at a symposium held at Columbia University to celebrate the 100th anniversary of the industry. Teller described the need to find energy sources other than fossil fuels to mitigate these dangers, stating, “a temperature rise corresponding to a 10 per cent increase in carbon dioxide will be sufficient to melt the icecap and submerge New York. All the coastal cities would be covered, and since a considerable percentage of the human race lives in coastal regions, I think that this chemical contamination is more serious than most people tend to believe.”
Edward Teller was at the height of his fame, being “credited with developing the world’s first thermonuclear weapon, and he became known in the United States as “the father of the H-bomb.” At the height of the cold war it must have been quite a coup to have one of the world’s leading physicists and noted anti-communist to give an address. As top executives from all the major oil companies would have been there, I would not sure they would have greeted the claims with rapturous applause. More likely thought the Professor has caught some new religion. They might have afterwards made some inquiries. Although climatology was in its infancy, the oil majors would have teams of geologists, who could make enquiries. The geologists may have turned up the Revelle and Suess 1957 paper Carbon Dioxide Exchange Between Atmosphere and Ocean and the Question of an Increase of Atmospheric CO2 during the Past Decades, 9 Tellus 18 (1957) that is mentioned in the previous paragraph of the Amicus Brief.
Revelle and Suess state in the Introduction
(A) few percent increase in the CO2 content of the air, even if it has occurred, might not produce an observable increase in average air temperature near the ground in the face of fluctuations due to other causes. So little is known about the thermodynamics of the atmosphere that it is not certain whether or how a change in infrared back radiation from the upper air would affect the temperature near the surface. Calculations by PLASS (1956) indicate that a 10% increase in atmospheric carbon dioxide would increase the average temperature by 0.36oC. But amplifying or feed-back processes may exist such that a slight change in the character of the back radiation might have a more pronounced effect.
So some experts in the field report that it is uncertain how much warming could occur from a small rise in CO2 levels. The only actual estimate is 0.36oC from a 10% rise. So how could that melt the icecap and flood New York? If this was first introduction that oil executives had to the concept of CO2-induced global warming might they have become a little on their guard about any future, more moderate, claims?
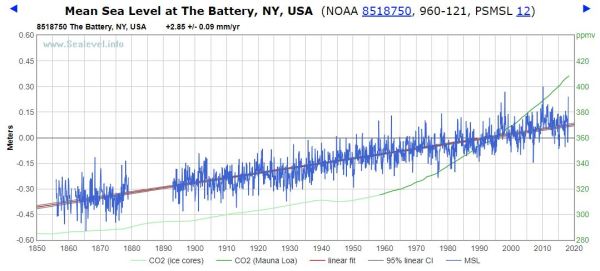
They would have been right to be uneasy. 1959 was the first full year CO2 levels were monitored at Mauna Loa, Hawaii. The mean CO2 Level for that year was 315.97 ppm. The 10% increase was passed in 1987, and for 2018 the figure was 408.52 ppm, 29.3% higher. The polar icecaps are still in place. From Sea Level Info, tide gauges show linear sea level rises over the last 59 years of 7.6 inches for Washington DC; 6.9 inches for Philadelphia 6.9 inches, and 6.6 inches for Battery at the tip of Lower Manhattan . This assumes a linear rise over 60 years.
The chart for The Battery, NY shows no discernible acceleration in the last 60 years, despite the acceleration in the rate of CO2 rise shown in green. It is the same for the other tide gauges.
The big question here is that 60 years later, what were the authors of the Amicus Brief thinking when they quoted such a ridiculous claim?
Lawyers for the charity previously argued the Government should have, in light of the current scientific consensus, gone further than its original target of reducing carbon levels by 2050 to 80% of those present in 1990.
They said the decision not to amend the 2050 target put the UK in breach of its international obligations under the Paris Agreement on Climate Change and was influenced by the Government’s belief that a “more ambitious target was not feasible”.
At a hearing on July 4, Jonathan Crow QC told the court: “The Secretary of State’s belief that he needs to have regard to what is feasible, rather than what is necessary, betrays a fundamental misunderstanding of the scheme of the 2008 Act and must be quashed.
“All of the individual claimants are deeply concerned about climate change.”
The barrister argued the Secretary of State’s “continuing refusal” to amend the 2050 target means the UK is playing “Russian roulette with two bullets, instead of one”.
But, refusing permission for a full hearing, Mr Justice Supperstone said Plan B Earth’s arguments were based on an “incorrect interpretation” of the Paris Agreement.
He said: “In my view the Secretary of State was plainly entitled … to refuse to change the 2050 target at the present time.
In a previous post I wrote that
Taking court action to compel Governments to enforce the Paris Climate Agreement is against the real spirit of that Agreement. Controlling global GHG emissions consistent with 2°C, or 1.5°C is only an aspiration, made unachievable by allowing developing countries to decide for themselves when to start reducing their emissions. ……. Governments wanting to both be players on the world stage and serve their countries give the appearance of taking action of controlling emissions, whilst in substance doing very little. This is the real spirit of the Paris Climate Agreement. To take court action to compel a change of policy action in the name of that Agreement should be struck off on that basis.
Now I would not claim Mr Justice Supperstone supports my particular interpretation of the Paris Agreement as an exercise in political maneuvering allowing Governments to appear to be one thing, whilst doing another. But we are both agreed that “Plan B Earth’s arguments were based on an “incorrect interpretation” of the Paris Agreement.”
The UNFCCC PDF of the Paris Agreement is here to check. Then check against my previous post, which argues that if the Government acted in the true spirit of the Paris Agreement, it would suspend the costly Climate Change Act 2008 and put efforts into being seen to be doing something about climate change. Why
China was praised for joining the emissions party by proposing to stop increasing emissions by 2030.
Very few of the INDC emissions will make real large cuts in emissions.
The aggregate forecast impact of all the INDC submissions, if fully enacted, will see global emissions slightly higher than today in 2030, when according to the UNEP emissions GAP report 2017 for 1.5°C warming target they need to be 30% lower in just 12 years time. Paris Agreement Article 4.1 states something that is empirically incompatible with that aim.
In order to achieve the long-term temperature goal set out in Article 2, Parties aim to reach global peaking of greenhouse gas emissions as soon as possible, recognizing that peaking will take longer for developing country Parties,
The Paris Agreement allows “developing” countries to keep on increasing their emissions. With about two-thirds of global emissions (and over 80% of the global population), 30% emissions cuts may not be achieved even if all the developed countries cut emissions to zero in 12 years.
Nowhere does the Paris Agreement recognize the many countries who rely on fossil fuels for a large part of their national income, for instance in the Middle East and Russia. Cutting emissions to near zero by mid-century would impoverish them within a generation. Yet, with the developing countries also relying on cheap fossil fuels to promote high levels of economic growth for political stability and to meeting the expectations of their people (e.g. Pakistan, Indonesia, India, Turkey) most of the world can carry on for decades whilst some enlightened Governments in the West damage the economic futures of their countries for appearances sake. Activists trying to dictate Government policy through the Courts in a supposedly democratic country ain’t going to change their minds.
Plan B have responded to the judgement. I find this statement interesting.
Tim Crosland, Director of Plan B and former government lawyer, said: ‘We are surprised and disappointed by this ruling and will be lodging an appeal.
‘We consider it clear and widely accepted that the current carbon target is not compatible with the Paris Agreement. Neither the government nor the Committee on Climate Change suggested during our correspondence with them prior to the claim that the target was compatible.
‘Indeed, it was only in January of this year that the Committee published a report accepting that the Paris Agreement was ‘likely to require’ a more ambitious 2050 target.
What I find interesting is that only point that a lawyer has for contradicting Mr Justice Supperstone’s statement that “Plan B Earth’s arguments were based on an “incorrect interpretation” of the Paris Agreement” is with reference to a report by the Committee on Climate Change. From the CCC website
The Committee on Climate Change (the CCC) is an independent, statutory body established under the Climate Change Act 2008.
Our purpose is to advise the UK Government and Devolved Administrations on emissions targets and report to Parliament on progress made in reducing greenhouse gas emissions and preparing for climate change.
The Committee is set up for partisan aims and, from its’s latest report, appears to be quite zealous in fulfilling those aims. Even as a secondary source (to a document which is easy to read) it should be tainted. But, I would suggest that to really understand the aims of the Paris Agreement you need to read the original and put it in the context of the global empirical and political realities. From my experience, the climate enlightened will keep on arguing for ever, and get pretty affronted when anyone tries to confront their blinkered perspectives.
In a speech from the White House Rose Garden filled with thorny lies and misleading statements, one pricks the most: Trump claimed that the Paris climate deal would only reduce future warming in 2100 by a mere 0.2°C. White House talking points further assert that “according to researchers at MIT, if all member nations met their obligations, the impact on the climate would be negligible… less than .2 degrees Celsius in 2100.”
The deeply prejudiced wording, written for an extremely partisan readership, encourages readers to accept the next part without question.
The 0.2°C estimate used by Trump may be from another MIT group; the Joint Program on the Science and Policy of Global Change did have such an estimate in early 2015, before all of the Paris pledges were in. But, their post-Paris 2016 analysis also concluded the impact of the full pledges was closer to 1°C.
New in this edition of the Outlook are estimates of the impacts of post-2020 proposals from major countries that were submitted by mid-August 2015 for the UN Conference of Parties (COP21) meeting in Paris in December 2015.
So what INDC submissions were in by Mid-August? From the submissions page (and with the size of total 2010 GHG Emissions from the Country Briefs) we get the following major countries.
In box 4 of the outlook, it is only Korea that is not included in the 0.2°C impact estimate. That is just over half the global emissions are covered in the MIT analysis. But there were more countries who submitted after mid-August.
The major countries include
My table is not fully representative, as the UNFCCC did not include country briefs for Nigeria, Egypt, Saudi Arabia, Iran, Iraq, Kuwait and UAE. All these countries made INDC submissions along with a lot of more minor GHG emitters. I would suggest that by mid-August all the major countries that wanted to proclaim how virtuous they are in combating climate change were the early producers of the INDC submissions. Countries like the Gulf States, India and Indonesia tended to slip their documents in somewhat later with a lot of measly words to make it appear that they were proposing far more than token gestures and pleas for subsidies. Therefore, the 0.2°C estimate likely included two-thirds to three-quarters of all the real emission constraint proposals. So how does an analysis a few months later produce almost five times the impact on emissions?
The second paragraph of the page the later article Joe Romm links to clearly states difference in methodology between the two estimates.
A useful way to assess that impact is to simulate the effects of policies that extend the Agreement’s 188 pledges (known as Nationally Determined Contributions, or NDCs) to the end of the century. In a new study that takes this approach, a team of climate scientists and economists from the MIT Joint Program on the Science and Policy of Global Change led by research scientist Andrei Sokolov finds that by 2100, the Paris Agreement reduces the SAT considerably, but still exceeds the 2 C goal by about 1 C.
The primary difference is that the earlier study tries to measure the actual, real world, impacts of existing policy, and policy pledges, if those policies are fully enacted. In the USA, those pledges would need Congressional approval to be enacted. The later study takes these submissions, (which were only through to 2030) and tries to estimate the impact if they were extended until 2100. That is renewables subsidies that push up domestic and business energy costs would be applied for 85 years rather than 15. It is not surprising that if you assume policy proposals are extended for over five times their original period, that they will produce almost five times the original impact. To understand this all that is required is to actually read and comprehend what is written. But Joe Romm is so full of bile for his President and so mad-crazy to save the planet from the evils of Climate Change and (mostly US) big business that he is blinded to that simple reality-check.
The fuller story is that even if all policies were fully enacted and extended to 2100, the impact on emissions would be far smaller than Joe Romm claims. That will be the subject of the next post.
This post is part of a planned series about climate delusions. These are short pieces of where the climate alarmists are either deluding themselves, or deluding others, about the evidence to support the global warming hypothesis; the likely implications for changing the climate; the consequential implications of changing / changed climate; or associated policies to either mitigate or adapt to the harms. The delusion consists is I will make suggestions of ways to avoid the delusions.
In the previous post I looked at how for the Karl el al 2015 paper to be a pause-buster required falsely showing a linear trend in the data. In particular it required the selection of the 1950-1999 period for comparing with the twenty-first century warming. Comparison with the previous 25 years would shows a marked decrease in the rate of warming. Now consider again the claims made in the summary.
Newly corrected and updated global surface temperature data from NOAA’s NCEI do not support the notion of a global warming “hiatus.” Our new analysis now shows that the trend over the period 1950–1999, a time widely agreed as having significant anthropogenic global warming, is 0.113°C decade−1 , which is virtually indistinguishable from the trend over the period 2000–2014 (0.116°C decade−1 ). …..there is no discernable (statistical or otherwise) decrease in the rate of warming between the second half of the 20th century and the first 15 years of the 21st century.
…..
…..the IPCC’s statement of 2 years ago—that the global surface temperature “has shown a much smaller increasing linear trend over the past 15 years than over the past 30 to 60 years”—is no longer valid.
The “pause-buster” linear warming trend needs to be put into context. In terms of timing the Karl reevaluation of the global temperature data was published in the run-up to the COP21 Paris meeting which aimed to get global agreement on reducing global greenhouse gas emissions to near zero by the end of the century. Having a consensus of the World’s leading climate experts admitting that warming was not happening strongly implied that there was no big problem to be dealt with. But is demonstrating a linear warming trend – even if it could be done without the use of grossly misleading statements like in Karl paper – sufficient to show that warming is caused by greenhouse gas emissions?
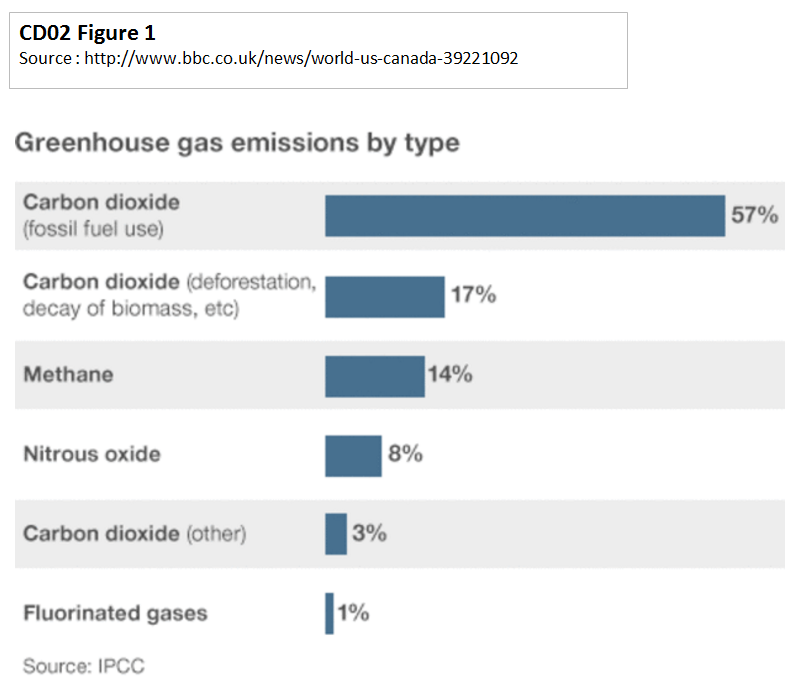
The IPCC estimates that about three-quarters of all greenhouse emissions are of carbon dioxide. The BBC’s recently made a graphic of the emission types, reproduced as Figure 1.
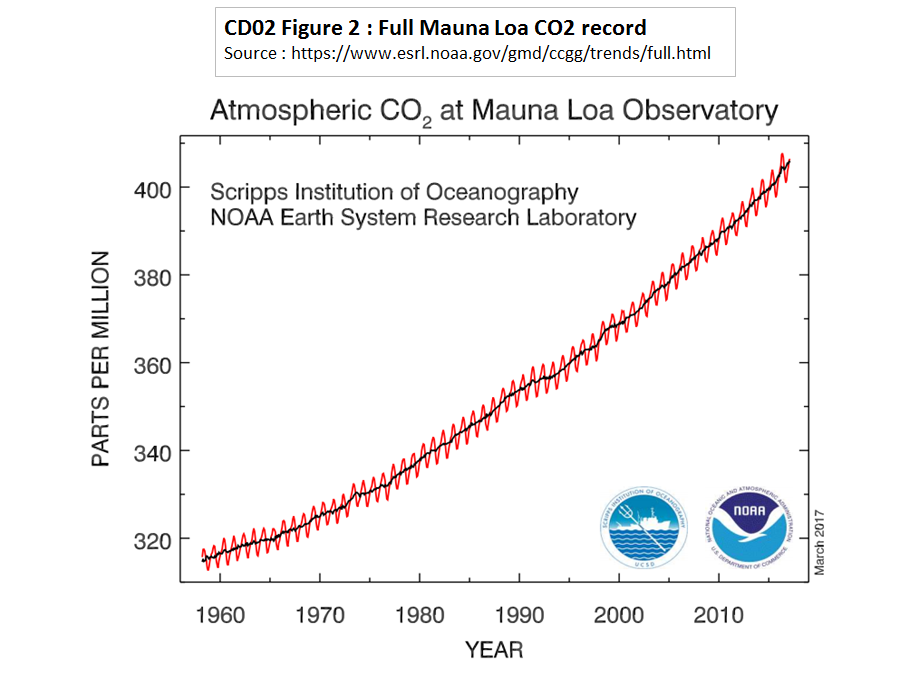
There is a strong similarity between the rise in CO2 emissions and the rise in CO2 levels. Although I will not demonstrate this here, the emissions data estimates are available from CDIAC where my claim an be verified. The issue arises with the rate of increase in CO2 levels. The full Mauna Loa CO2 record shows a marked increase in CO2 levels since the end of the 1950s, as reproduced in Figure 2.
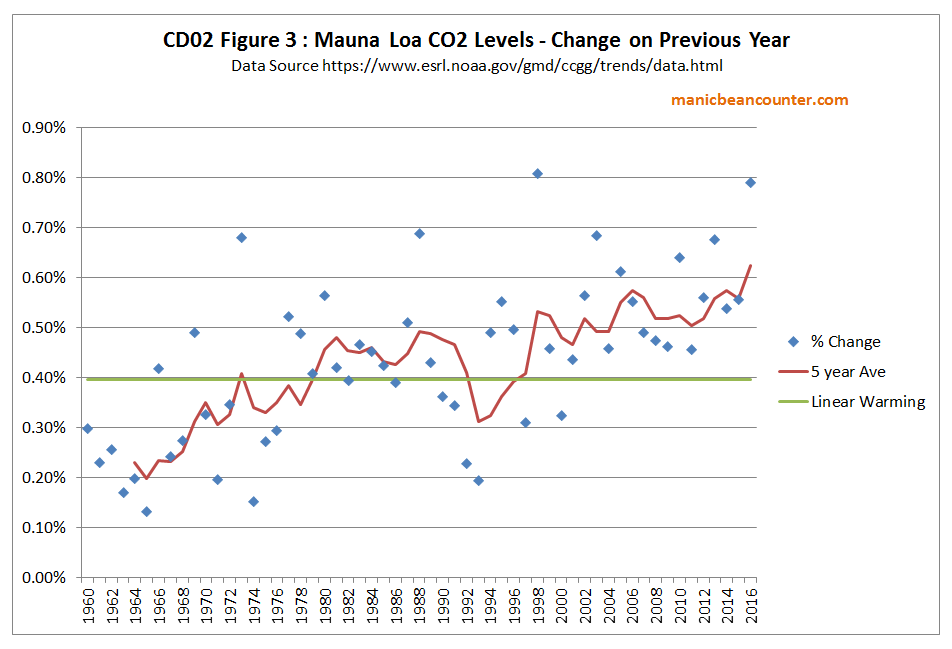
What is not so clear is that the rate of rise is increasing. In fact in the 1960s CO2 increased on average by less than 1ppm per annum, whereas in the last few years it has exceeded over 2ppm per annum. But the supposed eventual impact of the impact of the rise in CO2 is though a doubling. That implies that if CO2 rises at a constant percentage rate, and the full impact is near instantaneous, then the rate of warming produced from CO2 alone will be linear. In Figure 3 I have shown the percentage annual increase in CO2 levels.
Of note from the graph
In every year of the record the CO2 level has increased.
The warming impact of the rise in CO2 post 2000 was twice that of the 1960s.
There was a marked slowdown in the rate of rise in CO2 in the 1990s, but it was only for a few years below the long term average.
After 1998 CO2 growth rates increased to a level greater for any for any previous period.
The empirical data of Mauna Loa CO2 levels shows what should be an increasing impact on average temperatures. The marked slowdown, or pause, in global warming post 2000, is therefore inconsistent with CO2 having a dominant, or even a major role, in producing that warming. Quoting a linear rate of warming over the whole period is people deluding both themselves and others to the empirical failure of the theory.
Possible Objections
You fail to isolate the short-term and long-term effects of CO2 on temperature.
Reply: The lagged, long-term effects would have to be both larger and negative for a long period to account for the divergence. There has so far been no successful and clear modelling, just a number of attempts that amount to excuses.
Natural variations could account for the slowdown.
Reply: Equally natural variations could account for much, if not all, of the average temperature rise.in preceding decades. Non-verifiable constructs that contradict real-world evidence, are for those who delude themselves or others. Further, if natural factors can be a stronger influence on global average temperature change for more than decade than human-caused factors, then this is a tacit admission that human-caused factors are not a dominant influence on global average temperature change.
This is the first is a planned series of climate delusions. These are short pieces of where the climate alarmists are either deluding themselves, or deluding others, about the evidence to support the global warming hypothesis; the likely implications for changing the climate; the consequential implications of changing / changed climate; or associated policies to either mitigate or adapt to the harms. The delusion consists is I will make suggestions of ways to avoid the delusions.
The concluding comments to the paper gives the following boast
Newly corrected and updated global surface temperature data from NOAA’s NCEI do not support the notion of a global warming “hiatus.” …..there is no discernable (statistical or otherwise) decrease in the rate of warming between the second half of the 20th century and the first 15 years of the 21st century. Our new analysis now shows that the trend over the period 1950–1999, a time widely agreed as having significant anthropogenic global warming (1), is 0.113°C decade−1 , which is virtually indistinguishable from the trend over the period 2000–2014 (0.116°C decade−1 ). Even starting a trend calculation with 1998, the extremely warm El Niño year that is often used as the beginning of the “hiatus,” our global temperature trend (1998–2014) is 0.106°C decade−1 —and we know that is an underestimate because of incomplete coverage over the Arctic. Indeed, according to our new analysis, the IPCC’s statement of 2 years ago—that the global surface temperature “has shown a much smaller increasing linear trend over the past 15 years than over the past 30 to 60 years”—is no longer valid.
In their paper, Karl’s team sums up the combined effect of additional land temperature stations, corrected commercial ship temperature data, and corrected ship-to-buoy calibrations. The group estimates that the world warmed at a rate of 0.086°C per decade between 1998 and 2012—more than twice the IPCC’s estimate of about 0.039°C per decade. The new estimate, the researchers note, is much closer to the rate of 0.113°C per decade estimated for 1950 to 1999. And for the period from 2000 to 2014, the new analysis suggests a warming rate of 0.116°C per decade—slightly higher than the 20th century rate. “What you see is that the slowdown just goes away,” Karl says.
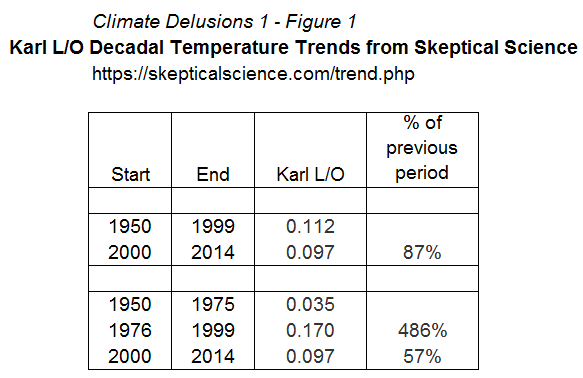
The Skeptical Science Temperature trend data gives very similar results. 1950-1999 gives a linear trend of 0.113°C decade−1 against 0.112°C decade−1 and for 2000-2014 gives 0.097°C decade−1 against 0.116°C decade−1. There is no real sign if a slowdown,
However, looking at any temperature anomaly chart, whether Karl. NASA Gistemp, or HADCRUT4, it is clear that the period 1950-1975 showed little or no warming, whilst the last quarter of the twentieth century show significant warming. This is confirmed by the Sks trend calculator figures in Figure 1.
What can be clearly seen is the claim of no slowdown in the twenty-first century compared with previous years is dependent on the selection of the period. To repeat the Karl et. al concluding claim.
Indeed, according to our new analysis, the IPCC’s statement of 2 years ago—that the global surface temperature “has shown a much smaller increasing linear trend over the past 15 years than over the past 30 to 60 years”—is no longer valid.
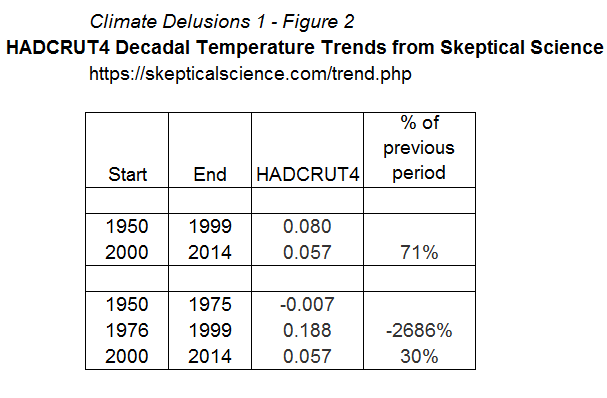
The period 1976-2014 is in the middle of the range, and from the Sks temperature trend is .160. The trend is significantly higher than 0.097, so a slowdown has taken place. Any remotely competent peer review would have checked what is the most startling claim. The comparative figures from HADCRUT4 are shown in Figure 2.
With the HADCRUT4 temperature trend it is not so easy to claim that there is no significant slowdown. But the full claim in the Karl et al paper to be a pause-buster can only be made by a combination of recalculating the temperature anomaly figures and selection of the 1950-1999 period for comparing the twenty-first century warming. It is the latter part that makes the “pause-buster” claims a delusion.