This is the first is a planned series of climate delusions. These are short pieces of where the climate alarmists are either deluding themselves, or deluding others, about the evidence to support the global warming hypothesis; the likely implications for changing the climate; the consequential implications of changing / changed climate; or associated policies to either mitigate or adapt to the harms. The delusion consists is I will make suggestions of ways to avoid the delusions.
Why is the Karl et al 2015 paper, Possible artifacts of data biases in the recent global surface warming hiatus proclaimed to be the pause-buster?
The concluding comments to the paper gives the following boast
Newly corrected and updated global surface temperature data from NOAA’s NCEI do not support the notion of a global warming “hiatus.” …..there is no discernable (statistical or otherwise) decrease in the rate of warming between the second half of the 20th century and the first 15 years of the 21st century. Our new analysis now shows that the trend over the period 1950–1999, a time widely agreed as having significant anthropogenic global warming (1), is 0.113°C decade−1 , which is virtually indistinguishable from the trend over the period 2000–2014 (0.116°C decade−1 ). Even starting a trend calculation with 1998, the extremely warm El Niño year that is often used as the beginning of the “hiatus,” our global temperature trend (1998–2014) is 0.106°C decade−1 —and we know that is an underestimate because of incomplete coverage over the Arctic. Indeed, according to our new analysis, the IPCC’s statement of 2 years ago—that the global surface temperature “has shown a much smaller increasing linear trend over the past 15 years than over the past 30 to 60 years”—is no longer valid.
An opinion piece in Science, Much-touted global warming pause never happened, basically repeats these claims.
In their paper, Karl’s team sums up the combined effect of additional land temperature stations, corrected commercial ship temperature data, and corrected ship-to-buoy calibrations. The group estimates that the world warmed at a rate of 0.086°C per decade between 1998 and 2012—more than twice the IPCC’s estimate of about 0.039°C per decade. The new estimate, the researchers note, is much closer to the rate of 0.113°C per decade estimated for 1950 to 1999. And for the period from 2000 to 2014, the new analysis suggests a warming rate of 0.116°C per decade—slightly higher than the 20th century rate. “What you see is that the slowdown just goes away,” Karl says.
The Skeptical Science Temperature trend data gives very similar results. 1950-1999 gives a linear trend of 0.113°C decade−1 against 0.112°C decade−1 and for 2000-2014 gives 0.097°C decade−1 against 0.116°C decade−1. There is no real sign if a slowdown,
However, looking at any temperature anomaly chart, whether Karl. NASA Gistemp, or HADCRUT4, it is clear that the period 1950-1975 showed little or no warming, whilst the last quarter of the twentieth century show significant warming. This is confirmed by the Sks trend calculator figures in Figure 1.
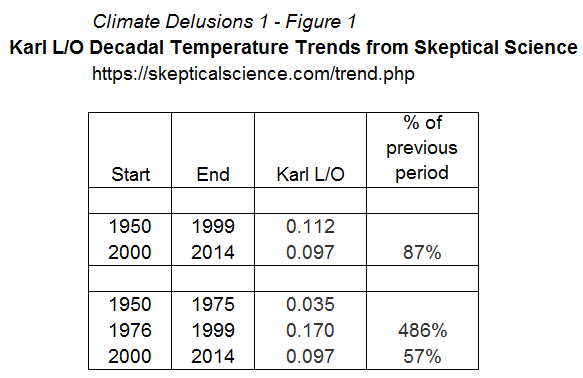
What can be clearly seen is the claim of no slowdown in the twenty-first century compared with previous years is dependent on the selection of the period. To repeat the Karl et. al concluding claim.
Indeed, according to our new analysis, the IPCC’s statement of 2 years ago—that the global surface temperature “has shown a much smaller increasing linear trend over the past 15 years than over the past 30 to 60 years”—is no longer valid.
The period 1976-2014 is in the middle of the range, and from the Sks temperature trend is .160. The trend is significantly higher than 0.097, so a slowdown has taken place. Any remotely competent peer review would have checked what is the most startling claim. The comparative figures from HADCRUT4 are shown in Figure 2.

With the HADCRUT4 temperature trend it is not so easy to claim that there is no significant slowdown. But the full claim in the Karl et al paper to be a pause-buster can only be made by a combination of recalculating the temperature anomaly figures and selection of the 1950-1999 period for comparing the twenty-first century warming. It is the latter part that makes the “pause-buster” claims a delusion.
Kevin Marshall

rw
/ 16/04/2017So it was nothing but a crude sleight of hand. I thought that 1950 starting date seemed a bit strange. But I hadn’t yet had time to go over the paper.
manicbeancounter
/ 16/04/2017There is a bit more to it than just a slight of hand. The recalculation did increase the trend post 2000 compared with HADCRUT4 or GISTEMP. But it is a slight of hand to say that the rate of warming was unchanged.