“New Energy Secretary opposed Rosebank oil field in previous job” – Miatta Fahnbulleh, who previously led the New Economics Foundation, attacked new fossil fuel projects as “irresponsible and shortsighted” before taking charge of the nation’s energy policy, says GB News.
As the GB News article notes, New Energy Secretary Miatta Fahnbulleh was formerly head of the New Economics Foundation, which, amongst other things, opposed the still-to-be-approved Rosebank oil field. Whilst being called an eco-zealot for previous statements on Twitter, Ms Fahnbulleh now states she now thinks decisions about the North Sea need a more pragmatic approach.
However, opposition to Rosebank based on economic grounds demonstrates a lack of understanding of economics. Or at least economics post the marginalist revolution of the 1870s. To understand the marginal climate impact (and thus any economic impact), we need some figures.
In an environmental impact assessment, it was estimated that the oil from the Rosebank oil field could emit 250 million tonnes of CO2 over its lifetime. That is 0.25 GtCO2. What is the impact on global emissions?
2021 IPCC AR6 WG3 SPM tells us “Historical cumulative net CO2 emissions from 1850 to 2019 were 2400 ± 240 GtCO2” at the 68% confidence interval. The Rosebank emissions would, at most, increase cumulative emissions by 0.01%. Given that CO2 emissions are still around 43 GtCO2 a year, and have increased slightly since 2019, this is an exaggeration.
But how much would Rosebank affect global average temperatures? Figure SPM.2 from AR6 WG1 SPM gives an indication.
Those 2400 GTCO2 of CO2 emissions accounted for, at most, half of the 1oC of warming from 1850 to 2019, if the negative impact of aerosols (mostly from the burning of fossil fuels) is taken into account. The marginal economic “climate” benefit of stopping Rosebank is zero, unless you deal with numbers much less than 1% of any statistical significance levels. This is if one accepts a 68% confidence interval. Normal statistics uses a 95% confidence, or double the confidence interval.
On the other hand, the economic benefits of approving Rosebank are highly significant to the people of the Shetland Islands. More generally, UK production of oil and gas mostly benefits the UK economy. But the benefits of costly UK climate policies on climate are global.
Looking at climate policy costs alone, failing to allow new oil and gas production in the North Sea is an opportunity cost borne by the UK. This might be a net benefit to the rest of the world as the UK imports oil and gas that it could have produced. The marginal climate benefits of such policies are highly insignificant. The British share of such benefits is likely much less than 1% of this highly insignificant amount. When thinking about this last point, remember that CO2 is a well-mixed trace gas. Thus any harms of heightened CO2 levels will be global. By implication, any prevented climate harms by arresting the rise in CO2 levels through CO2 emissions reductions will be global.
A short further step is needed. Assume all countries adopt broadly similar emissions reduction policies. Then for any one country the costs of climate mitigation policies will always vastly exceed the climate benefits (prevented future costs) of that mitigation. Nearly all the climate benefits will be gotten for free from the policies of the rest of the world. There is the biggest economic free rider problem ever imagined.
This free rider problem for uniform global policies is just theoretical. When opportunity costs are taken into account, most countries face much larger mitigation costs than Nordhaus and others conceive. The opportunity costs for countries dependent on fossil fuel production (like Kuwait, Saudi Arabia or Russia) are much greater than for countries (like Italy or Spain) with very few resources. More widely accepted are the opportunity costs for developing countries. Constraining emissions growth, or even cutting emissions growth, would constrain economic growth. The opportunity costs over decades would be enormous. Yet without the whole world having similar policies, economically it does not make sense for any country to reduce its emissions.
Economic theory has yet to work through this logic. It means that even the most rigorous analysis of the economics of climate change (such as that of 2018 Nobel Laureate William Nordhaus) is rendered useless. Cutting emissions by the UK will always impose costs greatly in excess of any benefits to the people of the UK. Only by making the false assumption that the world is a unitary policy-making body with similar cost structures can a conclusion be drawn that the benefits of emissions cutting exceed those of the policy costs.
There’s a very old joke I’d like to share with you, and it goes something like this:
A man is found repeatedly firing an elephant gun in the local park. “What are you doing that for?” he is asked. “It’s to scare away the elephants”, he opines. “But there are no elephants in this park”, comes the reply. “See,” he smiles, “it’s working already”.
Now, if you were to believe the man with the elephant gun, what you would be dealing with here is a perfect example of what is known as the Preparedness Paradox (sometimes ‘Preventative Paradox’). It is a paradox in which the removal of a problem is misinterpreted as evidence that the problem never existed in the first place.
The “Preparedness Paradox” using RCP8.5 was much in evidence in the run-up to and during COP21 Paris in December 2015. But there was another element that I am unable to name.
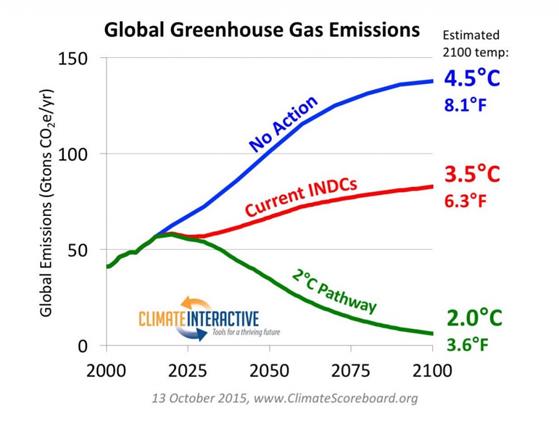
In the run-up to COP21, nearly every country submitted an INDC (Intended Nationally Determined Contributions). These were primarily to show emissions projections with and without policy through to 2030. Not the UK, as the EU did a joint INDC. Several organisations put forward projections on how the aggregate of the INDCs would play out through to 2100. One such group was Climate Interactive. Using RCP8.5 as a baseline, they projected that the effect of the INDCs would be to constrain 2100 warming to 3.5oC. Just a degree less warming.
The UNFCCC, using a different method, claimed the INDCs would constrain warming to 2.7 °C.
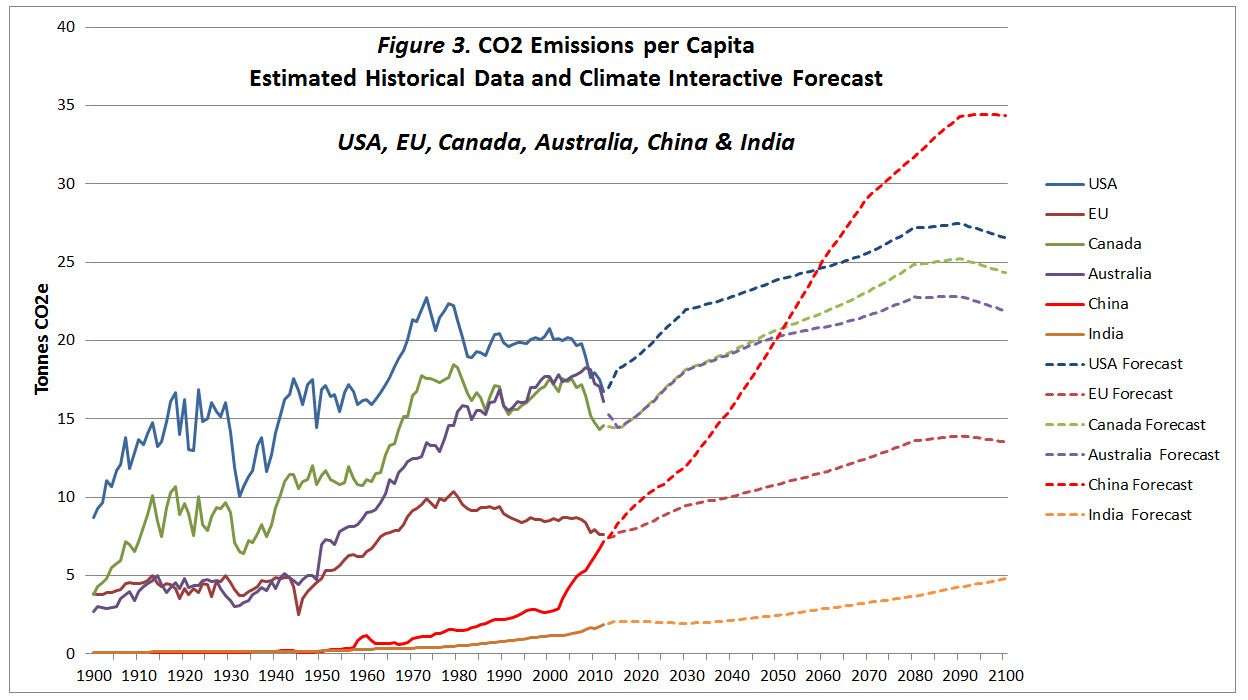
As Climate Interactive C-Roads software allowed downloads, I had a little play with the data. C-Roads had extracted data from the RCP database. This has separate model outputs for each of the four RCPs and for each greenhouse gas. To keep things simple, RCP divides the world into five, rather odd, regions. C-Roads then split out the EU and about 20 major countries from these regions. I downloaded the RCP8.5 CO2 emissions data along with the UN population projections from C-Roads. The CO2 data is expressed in grams of carbon, instead of tonnes of CO2. After a bit of data manipulation, I produced the following chart.
In the actual data to 2012, CO2 emissions per capita have fallen since 1980 in both the USA and the EU27. This is due to various factors, but in general advanced economies grow both through services and through high-value manufacturing. There is no economic reason for either to rise to well beyond pre-1973 peaks. The projection in China is simply crazy. It is this way in part because China’s population is projected to fall to 1 billion by 2100. Indeed, all but one country confirms the “Preparedness Paradox”. That country is India.
The projected CO2 emissions for India were so low that even the 2015 estimate was around 30% below the estimate. The figures for Africa (excluding South Africa) were even worse. Per capita CO2 emissions will barely increase. In other words, more professional BAU scenarios for India and Africa would generate the opposite of the elephant gun approach.
An idea of the revision upwards for India can be gained from the INDC submission. This included the target “to lower the emissions intensity of GDP by 33% to 35% by 2030.“. But this intensity decrease was in the context of an assumed GDP growth of 7.2%. That would imply an 80% increase in emissions in 15 years, at an annual growth rate of ~4%. Emissions in 2014 were 84% higher than in 1999 (3083 and 1980 MtCO2e), so the projection was hardly an exaggeration. 2024 emissions were 42% higher than in 2014 (4371 and 3083 MtCO2e), implying an emissions growth rate of ~3.5%
Another example is Nigeria. In its INDC submission, Nigeria projected its GHG emissions to grow 114% by 2030. But it would unconditionally cut this by 20%. With external financing, it would be cut by 70% relative to BAU. That is, even with external financing, emissions would increase by a third. Yet 1999-2014 GHG emissions only increased by 20%, and 2024 emissions were just ~11% higher than in 2014. No climate financing has been arranged. Nigeria was not alone in publishing a highly exaggerated BAU scenario. I cannot believe that the UNFCCC estimated the impacts of INDCs took these exaggerations fully into account. Neither would Climate Interactive. Whilst RCP8.5 is a gross exaggeration, 2100 emissions projections based on 2015 INDCs
So, whilst you would expect the inputting INDCs into the Climate Interactive C-Roads database to correct the crazy forecasts, these are partly offset by upward revisions elsewhere. But these revisions using INDCs would have been a little circumspect. Whether even a 50% increase in CO2 emissions in 85 years is realistic (even with emission reduction policies in some countries) is another story. As is my extrapolation from AR6 WG1 SPM table SPM.2 that constant global CO2 emissions 2020-2100 would produce ~3.5 °C of warming in 2100.
Last month the BBC headlined an article “Shell facing first UK legal claim over climate impacts of fossil fuels“. Typhoon Rai hit the Philippines in late 2021, damaging millions of homes and resulting in 400 deaths. Some of those affected are suing major oil producer Shell in UK courts, claiming that its emissions had a material impact on the severity of that typhoon. The BBC article states
The company has “materially contributed” to human driven climate change, the letter says, that made the Typhoon more likely and more severe.
The group wants to apply Philippine law (where the damage occurred) in a case to be heard in English courts. I will apply my rather cursory understanding of English tort law. That is, it is up to the litigant to prove their case on the balance of probabilities in an adversarial court system. A case is proved with clear evidence. In this case, each piece of evidence needs to be critically reviewed in light of the connection between human emissions and rising greenhouse gas levels; rising greenhouse gas levels and global average temperature rise; the rise in global average temperatures causing (or excerbating) Typhoon Rai; and the damage caused (especially injury and death being related to some function of (a) the strength of the storm and (b) the population impacted). Being a (somewhat) manic former beancounter, I will concentrate on the empirical data. I will also use a Greenpeace article from 23/10/25, which provides much more detail and a useful link to an attribution study.
That 2% figure
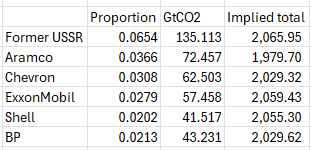
The BBC article states “that Shell is responsible for 2% of historical global greenhouse gases“. This is incorrect. The Greenpeace article gets closer, when it states “41 billion tons of CO2e or more than 2% of global fossil fuel emissions.” Going to the Carbon Majors Shell Page, the information box states that the 41.092 GtCO2 is 2.04% of the total CO2 emissions tracked by Carbon Majors from fossil fuels and cement for the period 1751-2013. This means that total emissions in the database were 2014 GtCO2.
Many would dispute whether a 2% contribution is a material contribution. There is a problem with this estimate. Anthropogenic CO2 emissions are mostly from fossil fuel emissions and cement production, but not entirely. There are also emissions from land-use changes. Further, I believe that the most authoritative source of anthropogenic CO2 emissions estimates are from the UNIPCC Assessment Reports. The most recent edition was the Sixth Assessment Report (AR6), published in 2021. AR6 WG3 SPM stated “Historical cumulative net CO2 emissions from 1850 to 2019 were 2400 ± 240 GtCO2 (high confidence)”. Footnote 10 states that this is at the 68% confidence interval. I was taught over 40 years ago that normal, acceptable, statistical confidence intervals were 95%, or double the 68% value. For a legal case in the UK, this should be confirmed by a Chartered Statistician (CStat) of the Royal Statistical Society (RSS), along with a validation of whether the confidence interval was calculated by a valid statistical method. AR6 used data from the Global Carbon Budget. AR6 is a bit coy about citing this source. However, searching “Friedlingstein” in the pdf of the full AR6 WG1 report, gives a reference to Friedlingstein et al., 2019. This is an annual, peer-reviewed article on the Global Carbon Budget.
The period 1850-2019 of the Global Carbon Budget is a century less than the Carbon Majors period of 1751-2023. To reconcile two data sets, I will ignore the period 1751-1849, as anthropogenic CO2 emissions were a tiny fraction of emissions since 1850. The Global Carbon Budget estimates CO2 emissions in 2019 at over 42 GtCO2, so the period 1850-2023 has emissions of 2570 ± (at least) 514 GtCO2. Ignoring the uncertainties, the Shell “share” of CO2 emissions becomes, at most, 1.6% of the total.
CO2 Emissions and Global Warming
However, this estimate ignores the impact of other greenhouse gas emissions on global warming. What about the impact of methane (CH4) emissions from bovine belching and flatulence? Or the methane emissions from sewage, or rotting waste? Or the Nitrous Oxide (N2O) emissions from burning heavy fuel oil in large container ships and supertankers?
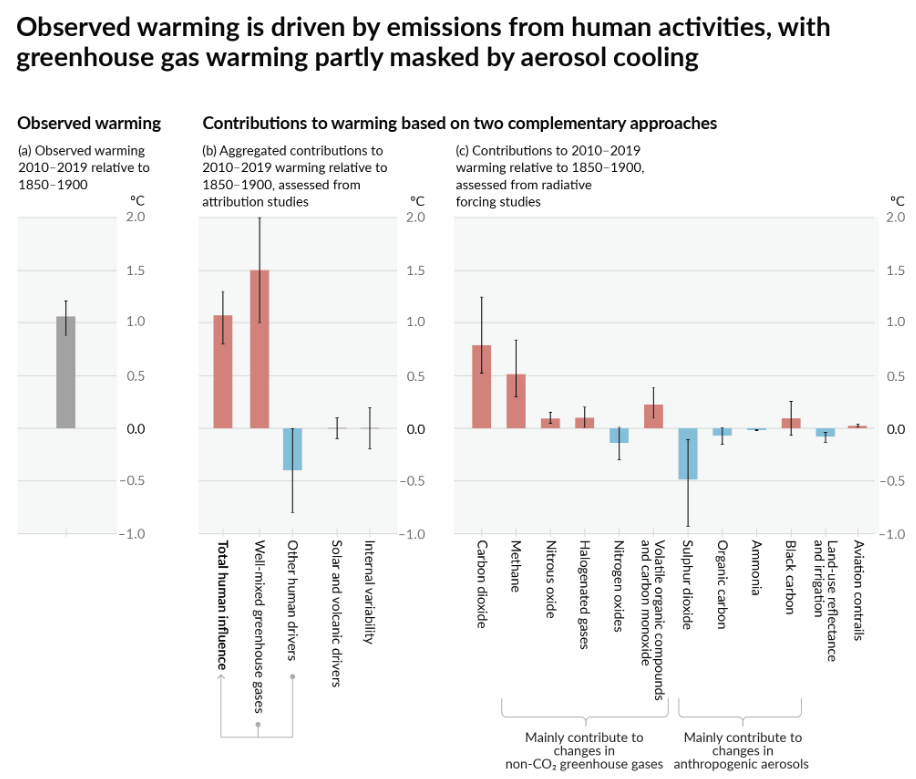
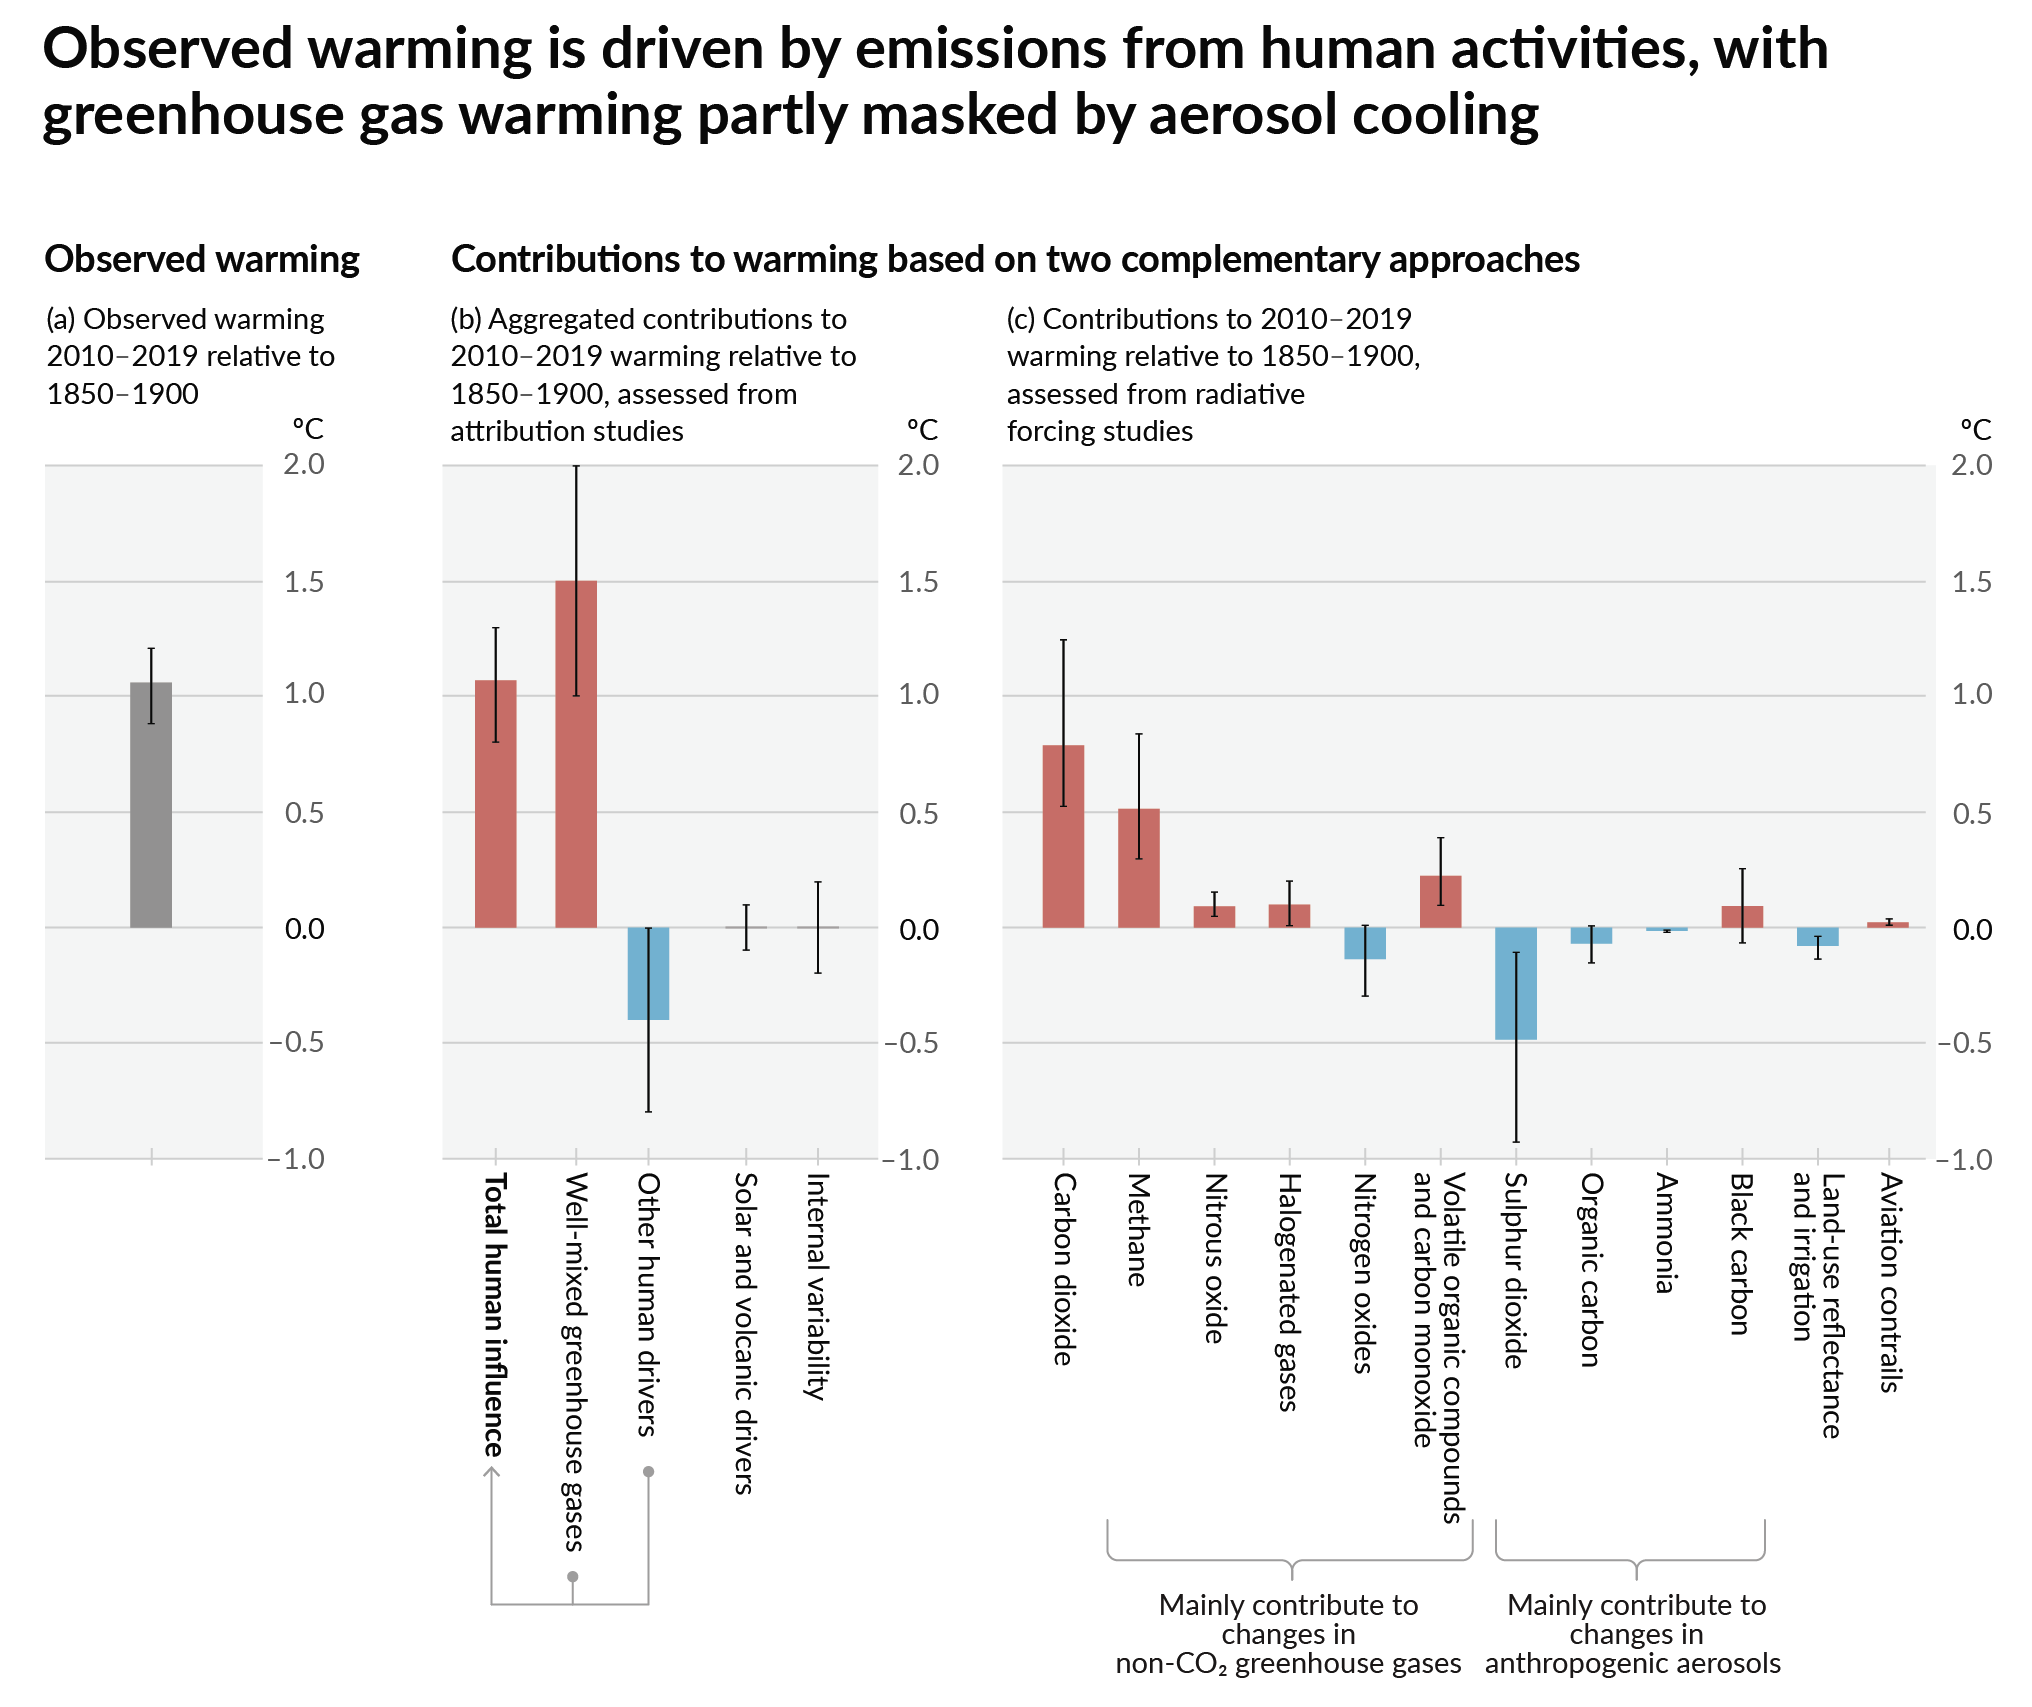
The last IPCC assessment report attempted to attribute the observed relative global warming from 1850-1990 to 2010-2019 to various radiative forcing factors. The key graphic from AR6 WG1 SPM is reproduced as figure 1.
Figure 1 : Figure SPM.2 in IPCC, 2021: Summary for Policymakers. In: Climate Change 2021: The Physical Science Basis. Contribution of Working Group I to the Sixth Assessment Report of the Intergovernmental Panel on Climate Change [Masson-Delmotte, V., P. Zhai, A. Pirani, S.L. Connors, C. Péan, S. Berger, N. Caud, Y. Chen, L. Goldfarb, M.I. Gomis, M. Huang, K. Leitzell, E. Lonnoy, J.B.R. Matthews, T.K. Maycock, T. Waterfield, O. Yelekçi, R. Yu, and B. Zhou (eds.)]. Cambridge University Press, Cambridge, UK and New York, NY,USA, pp. 3−32, doi: 10.1017/9781009157896.001 .]
The key graphic is (c). Carbon dioxide emissions created about 0.8 °C of warming, of which around 80% was from the burning of fossil fuels. Adding to this are the methane emissions from the production of fossil fuels, along with the nitrous oxide and carbon monoxide emissions. Subtracting from this are emissions of nitrogen oxides and sulphur dioxide. The net impact is that about two-thirds of the observed warming. Pro rata, Shell is “responsible” for around 1% of the warming impact or about 0.01 °C of average global temperature over 150 years. Even this could very well be an exaggeration for two reasons. First, the calculated average temperature rise could be biased upwards. Second, some of the true average temperature rise could be due to natural factors, including variations caused by the chaotic nature of climate, or highly complex factors that are incapable of being described by scientific modelling. Much of the warming could be due to a rebound from a period called the Little Ice Age. Further, there was considerable warming during 1910-1940 in the data sets, which, a few years ago, was comparable in magnitude to the post-1975 warming. Yet the global emissions and the rate of rise in CO2 levels were considerably lower than in the later period.
Even using the data from the IPCC AR6, it is very difficult to establish, using a balance of probabilities criterion, that 41 GtCO2 of CO2 emissions raised global average temperatures by at least 0.01 °C since 1850-1900.
Impact of global warming on Typhoons in the Philippines
The BBC article grabbed my attention with the claim that human-caused emissions had made Typhoon Kai both more likely and severe. I am somewhat sceptical, as my cursory knowledge of the empirical evidence is that there is no convincing support for the hypothesis that tropical cyclones (typhoons in the eastern hemisphere, hurricanes in the western hemisphere) have increased markedly since the mid-70s when the rate of global average temperature rise took off. Such a correlation, if established, would be the starting point for claiming that the warming caused the increase.
There are two sources.
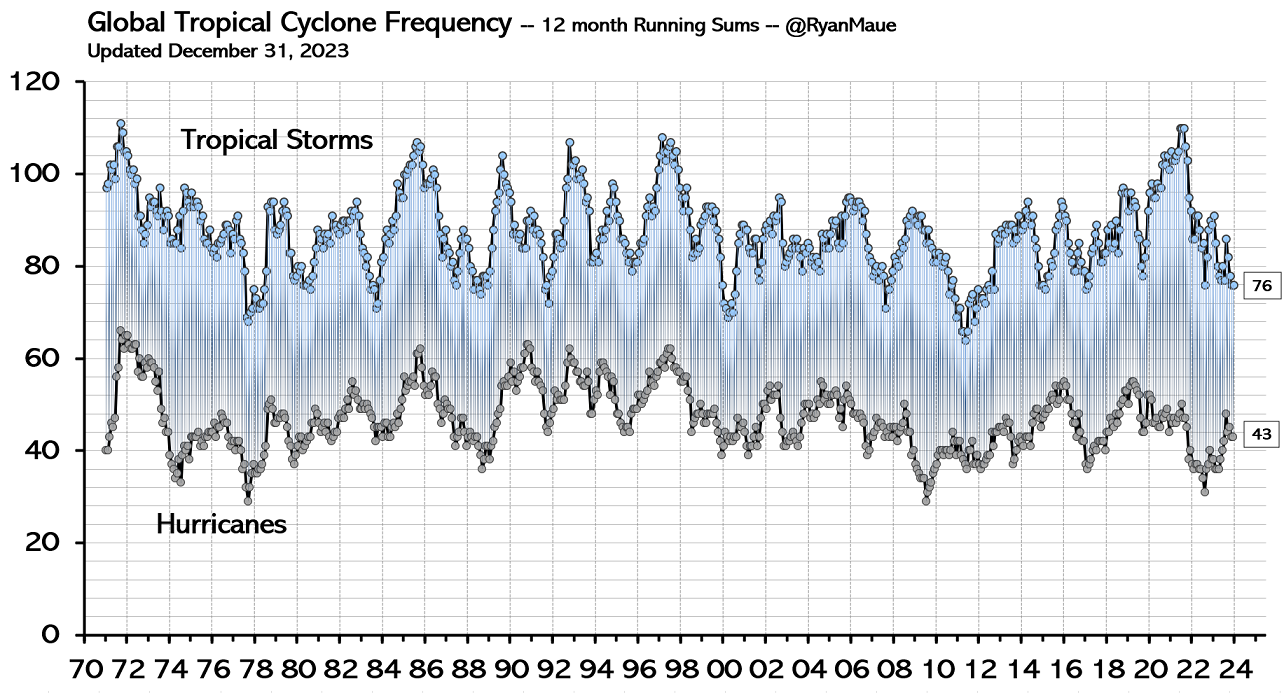
First is a couple of charts from Meteorologist Ryan Maue. These are of tropical cyclone frequency, and global tropical cyclone accumulated cyclone energy (from a peer-reviewed article). Both show data from the early 1970s. Cyclone frequency shows no trend. The cyclone frequency chart is more interesting. There are two major humps in the 1990s; a single peak in the 2000s; a relative energy drought 2008-2015; twin humps 2015-2020 smaller than the 1990s: then a decline into 2023 when the data ceases. At the foot of the chart there is a note. “Global data completeness much lower in the 1970s.” In terms of complete decades, the 1990s and 2000s seem tied for first, then the 2010s, with the 1980s in clear last place.
The second source has charts of Continental US hurricanes making landfall from Roger Pielke Jr. The big advantage is 125 years of consistent data, with no trend in all hurricanes or major hurricanes of Cat 3 and above. With this latest data is an accumulated cyclone energy chart for 1980-2024. This one has a single bar for each calendar year, with a slight downward trend.
With these data-driven prejudices, I took a look at the attribution study that supported the claim of human-caused climate change making Typhoon Rai more likely and more severe. This is, according to the Greenpeace Article, Clarke et al 2025 (The influence of anthropogenic climate change on Super Typhoon Odette (Typhoon Rai) and its impacts in the Philippines). The abstract states
First, we check that the current generation of higher resolution models used in attribution studies can capture the low sea level pressure anomaly associated with Typhoon Odette and hence can be used to study this type of event. A short analysis then compares such circulation analogues and the associated meteorological extremes over three time periods: past (1950-1970), contemporary (2001-2021), and future (2030-2050). Second, a multi-method multi-model probabilistic event attribution finds that extreme daily rainfall such as that observed during Typhoon Odette, has become about twice as likely during the Typhoon season over the southern-central Philippines due to ACC. Third, a large ensemble tropical cyclone hazard model finds that the wind speeds of category 5 landfalling typhoons like Odette have become approximately 70% more likely due to ACC.
Viewing the data analysis and modelling as a black box, inputting data for 1950-1970 and 2001-2021 leads to the conclusion that Cat 5 Typhoon Odette (Rai) was made 70% more likely due to anthropogenic climate change (ACC). To ensure that this conclusion is not an artifact of inconsistent data quality, the processing of that data before inputting it into the models, and the modelling, one would need to see the complete set of raw data. As a preliminary, a count of each category of typhoon for each of the seven decades, or even by year. Why is this important? On a global level, Ryan Maue warned that global data completeness was much lower in the 1970s, which implies that it was improving. That improvement would have been most marked in the areas with the lowest completeness before the 1970s. The Philippines, a developing country made up of a many islands, probably had much poorer data quality in 1950-1970 than the continental USA. Yet Clarke et al is able, in Figure 1, to show maximum wind speeds as Odette/Rai tracked across the mid-Philippines. Data that could have only come from satellites. 60 years earlier, the calculation of typhoon strength could only have come from measurements on the ground, which may have been very few. Therefore, that raw data could often understate the typhoon category. And if there is no data for measured sub-Cat 1 typhoons, then the total number might be understated. Quite detailed data processing is therefore required to obtain approximately comparable data for the 1950s & 1960s with the 21st century. The less processing, the greater the chance of showing an increase that does not exist in reality, but the greater the processing, the greater the distance from actual data. Does Clarke et al tackle this issue?
Under 3.2.1 Observational data on page 18 is stated
In this section, we use a range of gridded observational and reanalysis products.
They haven’t even examined the real raw data. We can’t get any appreciation of how much the data has been transformed.
All is not lost for those who want to make a case for an ACC-caused increase in major typhoons in the Philippines. The UNIPCC has been struggling to make the connection for decades on a global basis. The 2021 AR6 WG1 (The Physical Science Basis) states in para A.3.4
It is likely that the global proportion of major (Category 3–5) tropical cyclone occurrence has increased over the last four decades, and it is very likely that the latitude where tropical cyclones in the western North Pacific reach their peak intensity has shifted northward; these changes cannot be explained by internal variability alone (medium confidence). There is low confidence in long-term (multi-decadal to centennial) trends in the frequency of all-category tropical cyclones. Event attribution studies and physical understanding indicate that human-induced climate change increases heavy precipitation associated with tropical cyclones (high confidence), but data limitations inhibit clear detection of past trends on the global scale.
At the broadest level, my skeptical empiricist view is confirmed. There is no clear evidence of tropical cyclones having increased globally. Which means that the likely claim of major tropical cylones increasing is of a trivial quantity, or minor tropical cyclones have decreased. The significant part is about the western North Pacific. Given that there are a number of other areas globally where tropical cyclones occur, this is somewhat that this is the only area where an ACC influence can be found. But the Philippines could be construed as being in the western North Pacific, if the boundary between north and south is strictly the equator. The main islands of the Philippines lie 5 °- 19 ° N, and the Tropic of Cancer 23.6 ° N. For that reason alone, it is worth investigating.
The full report has quite a few mentions of this finding. on page 1747 is the following reference
Sun, J., D.Wang, X. Hu, Z. Ling, and L.Wang, 2019: Ongoing Poleward Migration of Tropical Cyclone Occurrence Over the Western North Pacific Ocean. Geophysical Research Letters, 46(15), 9110–9117, doi:10.1029/2019gl084260.
Fortunately, the paper is open access. The Key Points are
Tropical cyclone occurrence has been shifting poleward to the coast of East Asia from areas south of 20°N from 1982 to 2018
The preferential tropical cyclone passage has switched from westward moving to northward recurving since 1998
The poleward migration may be primarily attributed to the cyclonic anomaly of the steering flow over East Asia
The main point here is that south of 20°N (which the Philippines occupies), tropical cyclone occurrence has been decreasing. In case of doubt about the geography, check the colourful Figure 1. If one accepts the attribution to human-caused climate change, then the people of the Philippines should be thanking fossil fuel producers, not suing them. However, I am trying to look at what can be established on the balance of probabilities criterion. To repeat the comment in the WG1 SPM
….it is very likely that the latitude where tropical cyclones in the western North Pacific reach their peak intensity has shifted northward; these changes cannot be explained by internal variability alone (medium confidence).
In my (non-legal) opinion, there are two statements in this quotation.
The first is that there is evidence of climatic changes in the western North Pacific. The evidence is from statistical data (with potential data issues), but it far exceeds the balance of probabilities criterion.
The second is a qualitative opinion by a group of experts trying to find evidence of human-caused climate change. Medium confidence is tantamount to the opinion that, applying the balance of probabilities criterion, not even a small part of the observed change can be attributed to human causes.
Linking storm deaths to storm magnitude
In November 1970, Typhoon Bhola hit East Pakistan (now Bangladesh) and West Bengal. The official estimate was 500,000 dead. Most people were killed by the resulting storm surge that flooded the low-lying Ganges Delta. Another tropical cyclone hit Bangladesh in April 1991, killing at least 139,000. These are likely the first and third highest death tolls in the historical record for the old state of Bengal, although the further one goes back, the vaguer the reports. However, since 1991, the reporting of cyclones has become much more precise. The total deaths recorded in all cyclones by Wikipedia (which might be far from complete) since then are below 1,000. The likely reason for a greater than 99% fall in the deaths is the implementation of procedures to save lives. Like storm shelters and/or evacuation of the most vulnerable areas in advance of a cyclone. For the Philippines, with two-thirds of the population of Bangladesh, I count around 21,000 storm deaths in the period 2000-2025. This is highly skewed. The highest reported death toll was Typhoon Haiyan (Yolanda) in 2013 (6,352), followed by Tropical Storm Washi (Sendong) in 2011 (2,546) and Typhoon Bopha (Pablo) in 2012 (1,901). The three years 2011-2013 accounted for just over half the deaths in 2000-2025. The death rate per year from all storms 2000-2011 was about 3 times higher than in 2014-2025. Typhoon Kai in 2021, with 410 deaths, ranks ninth on the list. Of the deaths in 2014-2025, the two worst years were 2022 (467) and 2021 (463). Whilst the Philippines looks to have made great strides in reducing deaths from storms, there is clearly some way to go. That is if the Wikipedia figures are anything to go by.
Deaths are just one measure of the human impacts of powerful storms. There are also injuries, damage to property and the disruption to people’s lives. There has been much research on this topic in general, along with investigations afterwards to understand how the wide range of those human impacts can be lessened when similar events occur in the future. Whether or not the frequency of typhoons is increasing.
Conclusions and additional thoughts
Typhoon Rai was a Category 5 tropical cyclone that crossed the Philippines in December 2021, killing around 410 people. The claim has been made that the calculated 41 GtCO2 (2% of historical emissions) of CO2 emissions generated from the burning of fossil fuels extracted by Shell materially contributed to the severity of the storm.
The 2% material contribution is likely much smaller. In terms of the contribution to the human-caused global warming up to 2021, it is difficult to establish, through rigorous application of the balance probabilities criteria to AR6 WG1 evidence, that this quantity of emissions resulted in even 1% of the warming during 1850-2019. Even then, IPCC modelling makes the assumption that all the actual rise in global average temperatures is human-caused, which seems unwarranted when compared with the empirical evidence.
Key to attributing that warming to a 70% increase in the frequency of Cat 5 typhoons is data showing that such storms have increased both globally and in the Philippines area. The global data does not show such an increase. An attribution study comparing 1950-1970 and 2001-2021 did not look at the raw data. Thus, the authors cannot have looked at data quality and consistency issues in the entire period 1950-2021.
The attribution paper’s claimed increase in the frequency Cat 5 typhoons might conflict with the AR6 WG1 SPM report. The only case, the report finds, of climatic changes to global cyclones globally implies a reduction in tropical cyclones in the area of the Philippines during 1982-2018. Of course, it might still be that tropical cyclones were higher in 2001-2021 compared to 1950-1970, whilst declining during 1982-2018. But that still undermines the attribution paper.
Arguments about whether tropical cyclones have increased or not are invalid if the issue at stake is the human cost. A cursory look at the number of deaths suggests the death toll from the strongest typhoons appears to have decreased by over 90% since a run of severe storms in 2011-2013. This reduction is probably due to measures taken to reduce the human impacts.
As Shell has stated, the case against them is baseless. It is probably more baseless than they realised.
There are some additional thoughts on the Carbon Majors database. The most obvious one is why Shell. After all, BP is the largest historic British fossil fuel producer by potential emissions, although just 4% more than Shell. Globally, at the top of the list is China with seven times the “responsibility” of Shell. More generally, the database has three types of entities. These are (with shares) Investor-owned Company (24%), Nation State (15%) and State-owned Entity (30%). Smaller entities make up the remaining 31%. In fairness, any action should be a class-action suit against the whole world. That is not going to happen, so any successful action taken against investor-owned companies in, say UK or the USA, will be to the benefit of State entities in, say, China, Russia or Iran.
The updated figures are below. If the figures and percentages are outputted from a single database, then dividing the GtCO2 figure by the percentage will give the same global total for emissions from fossil fuels. There is significant variation. For instance, the Aramco figure of 72.457 is 3.66% of 1980, or 3.51% of 2066.
There is a belief, throughout the world, that a particular emissions reduction policy will save the planet from a climate catastrophe. An extreme form was the Just Stop Oil protests that plagued London and other cities. Their major demand was for no new oil and gas production within UK territory. A particular target was the proposed Rosebank oil field, a site about 200km due north of the Scottish mainland and located under 1100 metres of water. The field may contain up to 300 million barrels of oil. The developers were ordered in January 2025 to conduct a climate impact assessment. The results are in, at least according to a recent BBC article.
The UK’s largest undeveloped oil field has revealed the full scale of its environmental impact, should it gain approval by the government.
Developers of the Rosebank oil field said nearly 250 million tonnes of planet warming gas would be released from using oil products from the field.
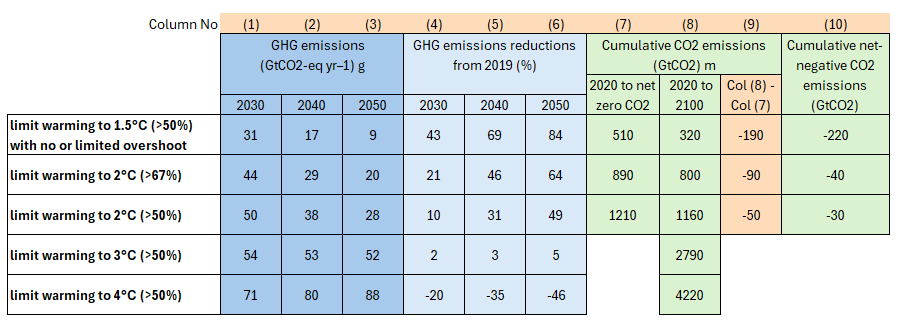
This is a ridiculous comment to make. Why? The climate impact of CO2 emissions is through raising atmospheric CO2 levels, which in turn causes rising global average temperatures. It is believed that this warming could have catastrophic consequences for the planet. So, how much warming will 250 million tonnes of CO2 (0.25 GtCO2) cause? I will first make the assumption that the oil from Rosebank will add to global oil consumption and not be instead of oil from say Russia, the Middle East, or Venezuela. The most authoritative source of data is from the UN IPCC Assessment Reports. In particular, from the 2021 AR6 WG3 Summary for Policymakers. This states historical cumulative net CO2 emissions from 1850 to 2019 were 2400 ± 240 GtCO2 (high confidence). A footnote on page 10 states that the ± 240 is at the 68% confidence interval. In statistics, a 95% confidence interval is conventional, which is double the ± 240 GtCO2. In AR6 various emissions pathways were calculated using that figure. Figure 1 is an extract from “Table SPM.2 | Key characteristics of the modelled global emissions pathways” on pages 18-19, looking at the additional emissions to reach various warming levels in 2100.
Figure 1: Extract from “Table SPM.2 | Key characteristics of the modelled global emissions pathways“, IPCC AR6 SPM. Uncertainty ranges not included. Data shaded orange are additions. Shaded blue refers to greenhouse gas (GHG) emissions. Shaded green refers to cumulative CO2 emissions. The report estimates that in 2019, CO2 emissions accounted for 75% of GHG emissions measured in CO2 equivalent tonnes.
Even though I have simplified the table (full table here), there are still a lot of figures to digest. Look at the top row – limit warming to 1.5 °C (>50%) – columns (7) – (9). To reach net zero requires 510 GtCO2, with -190 GtCO2 before 2100 to get a >50% chance of global average temperature rise not exceeding 1.5 °C above 1850 levels in 2100.* The similar figures for 2.0 °C are 1210 and -50 GtCO2. Taking the difference of the col (8) figures (1160-320) gives 840 GtCO2 for 0.5 °C of “warming”. By inference, 0.25 GtCO2 will give about 0.00015 °C of warming.
Thus, even if the Rosebank oil field were 1000 times larger – containing over 8 years of global oil production instead of 3 days – it would still have no significant impact on global average temperatures in the context of the AR6 climate pathways. Hence, the climate impact of the Rosebank oil field is nil. The same can be said of any project in the UK, or indeed, the whole of UK climate policies slavishly tracking the 1.5 °C pathway, including net negative emissions after 2050.
But could it be argued that, although the quantity of emissions that would emanate from Rosebank oil is insignificant, it is still part of a successful global emissions reduction policy? This is not the case. The UNEP Emissions Gap Report 2024 highlights that 2023 was a new record for GHG emissions at 57.1 GtCo2e. 2030 is likely to see emissions slightly higher than in 2019, consistent with just over 3 °C of warming in 2100 in IPCC AR6 projections. Why some countries, like the UK, follow emissions reduction policies in line with the 1.5 °C pathway when the world as a whole does not is a question that will be answered in an article in preparation.
Kevin VS Marshall
*NB. The net 320 GtCO2 for 2020-2100 1.5 °C emissions pathway is less than the 480 GtCO2 confidence interval in the historical CO2 emissions estimate.
Whilst Anthony Watts was speaking on the Climate Realism show, the main screen was scrolling through the Environmental Defense Fund (EDF) and the Union of Concerned Scientists (UCS) “COMPLAINT FOR DECLARATORY, INJUNCTIVE, AND MANDAMUS RELIEF” document. Part of Paragraph 27 stood out.
EPA’s final finding rested on a vast body of rigorous, peer-reviewed scientific research confirming that greenhouse gas pollution is driving destructive changes in our climate that pose a grave and growing threat to Americans’ health, security, and economic well-being.
Let us follow the “Consensus Science” on this one. Hansen et al. 1988 (the paper behind the 1988 staged event that really launched the global climate hysteria), states that greenhouse gases are well-mixed. That means it does not matter where in the world anthropogenic emissions originate; each unit of these trace gases affects the levels in equal measure. Capitalist countries do not emit a more pernicious form of CO2 than, say, communist ones. Yet, International law related to climate is written as if this were the case. A detailed exposition of that international law is contained in a recently issued Judgement by the International Court of Justice, “OBLIGATIONS OF STATES IN RESPECT OF CLIMATE CHANGE“. Paragraph 179 states
The principle of common but differentiated responsibilities and respective capabilities is a cardinal principle of the climate change treaty framework, which is incorporated in several provisions of the climate change treaties (see UNFCCC, preamble, Article 3, paragraphs 1 and 2, and Article 4; Kyoto Protocol, Article 10; Paris Agreement, Article 2, paragraph 2, and Article 4, paragraphs 3, 4 and 19; see also paragraphs 148-151 above)……
What does “the principle of common but differentiated responsibilities” mean? This is spelt out in the UN Framework Convention on Climate Change (UNFCCC) 1994 Article 4.7
The extent to which developing country Parties will effectively implement their commitments under the Convention … will take fully into account that economic and social development and poverty eradication are the first and overriding priorities of the developing country Parties.
Developed country Parties should continue taking the lead by undertaking economy-wide absolute emission reduction targets. Developing country Parties should continue enhancing their mitigation efforts, and are encouraged to move over time towards economy-wide emission reduction or limitation targets in the light of different national circumstances.
That is, under UN law, there is a two-track approach to cutting emissions. Only developed Western countries have an obligation to cut their emissions in the near future. The rest of the world following on at a some yet to be agreed upon point in the future. The idea of a unified global approach to emissions reductions are an illusion in the mind of climate activists. Therefore, net zero policies, or talk of achieving following some 1.5 °C and 2 °C emissions pathways are just narratives to impose costly and pretty much useless policies on a few countries.
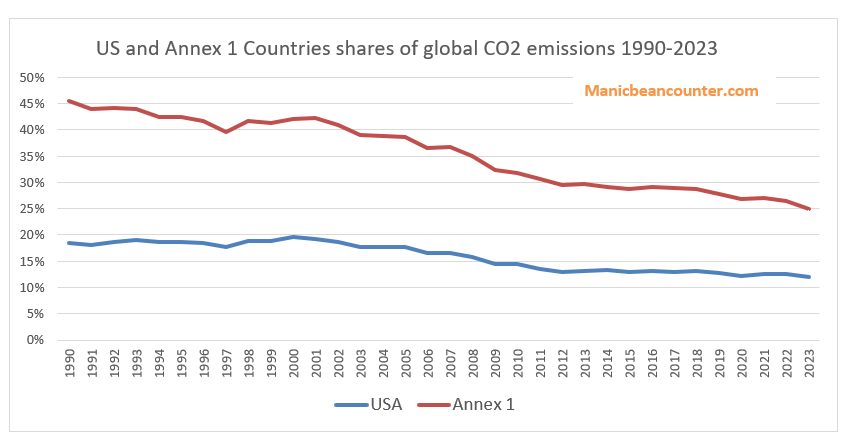
How has this played out? Under the UNFCCC Treaty, the developed (or Annex 1) countries include the more developed parts of the former Soviet Union. But Russia, Belarus and Ukraine have been temporarily excluded for the last 30+ years as “economies in transition”. That leaves the USA, EU, Japan, Canada, Australia and UK as the main radical emissions-cutting countries, along with Mexico and Türkiye, whose emissions have massively increased since 1990. How does that work out? US CO2 Emissions declined 3% from 1990-2023, but have declined as a share of the global total from 18.5% to 12.0%. The share declined due to CO2 emissions in the “developing countries” increasing during 1990-2023 by 105%. In other words, now seven-eighths of the CO2 “pollution” affecting Americans emanates from outside the USA. Further, the EPA endangerment finding covers just a part of the national policies. These consensus scientists should realise that the EPA Endangerment Finding is severely limited territorially. If policy is evaluated from the standpoint of achievable goals, then any emissions constraint policy by the US in whole or in part that aims to stop “climate change” will fail.
Figure 1 : US and Annex 1 Countries’ shares of global CO2 emissions 1990-2023. Source : Global Carbon Budget – Sum of “Territorial” CO2 emissions (mostly fossil fuel emissions) and “Land-use Changes”.
For the first time this report highlights that UK sea level is rising faster than the global average.
As sea levels continue to rise around the UK, the risk of flooding is only going to increase further, says Dr Svetlana Jevrejeva from the National Oceanography Centre.
The examples that the BBC gives of flooding in 2024 at Tetbury and Stratford-upon-Avon are significantly above sea level, and many miles inland. But why let facts get in the way of a good narrative.
On sea-level rise, the Met Office Executive Summary states
Sea level rise around the UK is accelerating.
Since 1901, the sea level around the UK has risen by about 19.5 cm, with two-thirds of this rise happening in just over the last three decades.
The last 3 years were the three highest on record for UK annual mean sea level in a series from 1901, with the 21st Century so far (2001–2024) including the 17 highest years.
Over the past 32 years (1993–2024) UK sea level has risen by 13.4 cm. This is higher than the global estimate of 10.6 cm calculated from satellite altimetry over the same period,
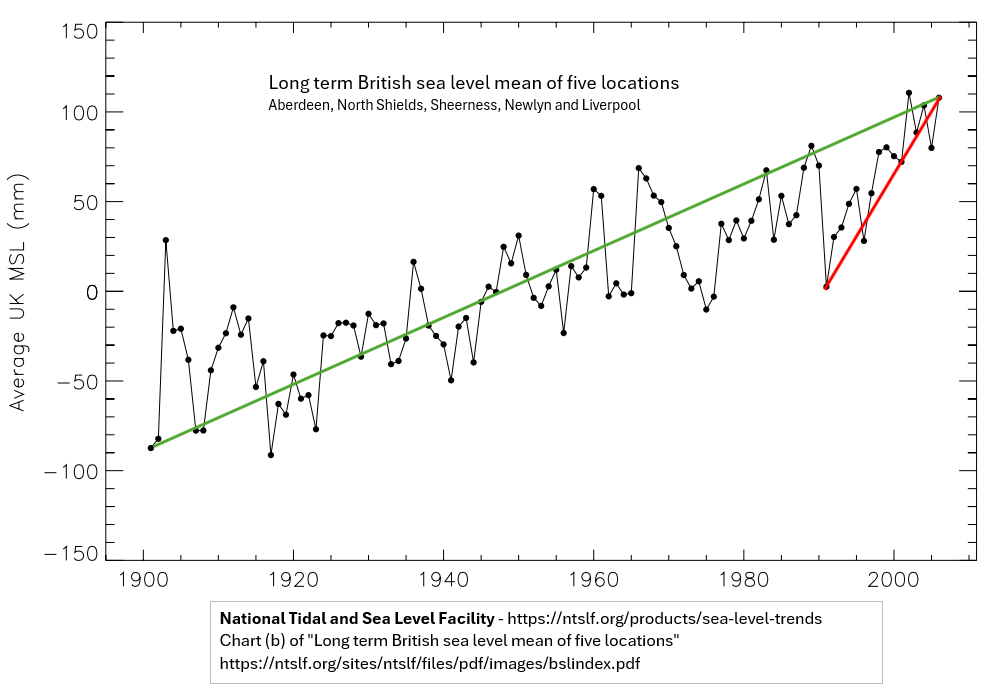
My first reaction on reading this was to assume that the Met Office had copied the methodology of the IPCC AR6 2022. That is, to splice the tide-gauge average data of 1901-1992 with the satellite data from 1993, then hope no one would notice that this splicing accounted for nearly all the apparent acceleration. However, although the year 1993 is there, it is apparent that the comments are derived from a single UK data set. A little research gets a graph of “long-term British sea level mean of five locations” at the National Tidal and Sea Level Facility. I have annotated the graph a little.
The graph does show that 2024 sea levels were about 19.5cm higher than in 1901. But 2024 sea levels were more like 10.5 cm higher than in 1993, not 13.4 cm. Further from 1992 to 1993, sea levels fell dramatically. Almost 7cm, equivalent to a third of the net increase over 124 years. From 1992 to 2024 sea levels rose about 3.8 cm or 1.2 mm yr-1, compared with 1.6 mm yr-1 in 1901-2024. In future Met Office ought to get a professional statistician to calculate trends and perform significance and sensitivity tests on the data. As for the 2024 report, it should be reissued with the unsubstantiated claims about accelerating sea-level rise removed.
This is an expanded version of a comment made at Paul Homewood’s notalotofpeopleknowthat blog.
Projected power demand is likely high, as demand will likely fall as energy becomes more expensive.
Report assumes massively increased load factors for wind turbines. A lot of this increase is from using benchmarks contingent on technological advances.
The theoretical UK scaling up of wind power is implausible. 3.8x for onshore wind, 9.4x for fixed offshore and >4000x for floating offshore wind. This to be achieved in less than 27 years.
Most recent cost of capital figures are from 2018, well before the recent steep rises in interest rates. Claim of falling discount rates is false.
The current wind turbine capacity is still a majority land based, with a tiny fraction floating offshore. A shift in the mix to more expensive technologies leads to an 82% increase in average levelised costs. Even with the improbable load capacity increases, the average levilised cost increase to 37%.
Biggest cost rise is from the need for storing days worth of electricity. The annual cost could be greater than the NHS 2023/24 budget.
The authors have not factored in the considerable risks of diminishing marginal returns.
Demand Estimates
The briefing summary states
The analysis shows that GB’s estimated practical wind and solar energy resources (2,896 TWh/year) are almost ten times current electricity needs (299 TWh/year) and easily exceed even the highest 2050 demand forecasts for all energy (1,500 TWh/year), including scenarios that involve electrification of much of the economy.
299 TWh/year is an average of 34 GW, compared with 30 GW average demand in 2022 at grid.iamkate.com. I have no quibble with this value. But what is the five-fold increase by 2050 made-up of?
From page 7 of the full report.
In 2021, UK primary energy demand was 1,978 TWh and final energy demand 1,599 TWh (Harris, 2022, p. 3). This was 4.7% higher than 2020, but 7.8% lower than pre-pandemic levels (Harris, 2022, p. 3). Electricity consumption in GB was 299 TWh (McGarry, 2022).
So 2050 maximum energy demand will be slightly lower than today? For wind (comprising 78% of potential renewables output) the report reviews the estimates in Table 1, reproduced below as Figure 1
Figure 1: Table 1 from page 10 of the working paper
The study has quite high estimates of output compared to previously, but things have moved on. This is of course output per year. If the wind turbines operated at 100% capacity then the required for 24 hours a day, 365.25 days a year would be 265.5 GW, made up of 23.5GW for onshore, 64GW for fixed offshore and 178GW for floating offshore. In my opinion 1500 TWh is very much on the high side, as demand will fall as energy becomes far more expensive. Car use will fall, as will energy use in domestic heating when the considerably cheaper domestic gas is abandoned.
Wind Turbine Load Factors
Wind turbines don’t operate at anything like 100% of capacity. The report does not assume this. But it does assume load factors of 35% for onshore and 55% for offshore. Currently floating offshore is insignificant, so offshore wind can be combined together. The UK Government produces quarterly data on renewables, including load factors. In 2022 this average about 28% for onshore wind (17.6% in Q3 to 37.6% in Q1) and 41% for offshore wind (25.9% in Q3 to 51.5% in Q4). This data, shown in four charts in Figure 2 does not seem to shown an improving trend in load capacity.
Figure 2 : Four charts illustrating UK wind load capacities and total capacities
The difference is in the report using benchmark standards, not extrapolating from existing experience. See footnote 19 on page 15. The first ref sited is a 2019 DNV study for the UK Department for Business, Energy & Industrial Strategy. The title – “Potential to improve Load Factor of offshore wind farms in the UK to 2035” – should give a clue as to why benchmark figures might be inappropriate to calculate future average loads. Especially when the report discusses new technologies and much larger turbines being used, whilst also assuming some load capacity improvements from reduced downtimes for maintenance.
Scaling up
The report states on page 10
UK wind capacity totals 28.5 GW comprising 14.7 GW onshore and 13.8 GW offshore.
From the UK Government quarterly data on renewables, these are the figures for Q3 2022. Q1 2023 gives 15.2 GW onshore and 14.1 GW offshore. This offshore value was almost entirely fixed. Current offshore floating capacity is 78 MW (0.078 GW). This implies that to reach the reports objectives of 2050 with 1500 TwH, onshore wind needs to increase 3.8 times, offshore fixed wind 9.4 times and offshore floating wind over 4000 times. Could diminishing returns, in both output capacities and costs per unit of capacity set in with this massive scaling up? Or maintenance problems from rapidly installing floating wind turbines of a size much greater than anything currently in service? On the other hand, the report notes that Scotland has higher average wind speeds than “Wales or Britain”, to which I suspect they mean that Scotland has higher average wind speeds to the rest of the UK. If so, they could be assuming a good proportion of the floating wind turbines will be located off Scotland, where wind speeds are higher and therefore the sea more treacherous. This map of just 19 GW of proposed floating wind turbines is indicative.
Cost of Capital
On page 36 the report states
According to BEIS, 2020 discount rates for solar, onshore, and offshore wind projects were 5.0%, 5.2%, and 6.3% respectively in the UK, down from 6.5%, 6.7%, and 8.9% in 2015 (BEIS, 2020b).
You indeed find these rates on “Table 2.7: Technology-specific hurdle rates provided by Europe Economics”. My quibble is not that they are 2018 rates, but that during 2008-2020 interests rates were at historically low levels. In a 2023 paper it should recognise that globally interest rates have leapt since then. In the UK, base rates have risen from 0.1% in 2020 to 5.25% at the beginning of August 2023. This will surely affect the discount rates in use.
Wind turbine mix
Costs of wind turbines vary from project to project. However, the location determines the scale of costs. It is usually cheaper to put up a wind turbine on land than fix it to a sea bed, then construct a cable to land. This in turn is cheaper than anchoring a floating turbine to a sea bed often in water too deep to fix to the sea bed. If true, moving from land to floating offshore will increase average costs. For this comparison I will use some 2021 levilized costs of energy for wind turbines from US National Renewable Energy Laboratory (NREL).
Figure 3 : Page 6 of the NREL presentation 2021 Cost of Wind Energy Review
The levilized costs are $34 MWh for land-based, $78 MWh for fixed offshore, and $133 MWh for floating offshore. Based on the 2022 outputs, the UK weighted average levilized cost was about $60 MWh. On the same basis, the report’s weighted average levilized cost for 2050 is about $110 MWh. But allowing for 25% load capacity improvements for onshore and 34% for offshore brings average levilized cost down to $82 MWh. So the different mix of wind turbine types leads to an 83% average cost increase, but efficiency improvements bring this down to 37%. Given the use of benchmarks discussed above it would be reasonable to assume that the prospective mix variance cost increase is over 50%, ceteris paribus.
The levilized costs from the USA can be somewhat meaningless for the UK in the future, with maybe different cost structures. Rather than speculating, it is worth understanding why the levilized cost of floating wind turbines is 70% more than offshore fixed wind turbines, and 290% more (almost 4 times) than onshore wind turbines. To this end I have broken down the levilized costs into their component parts.
Figure 3 : NREL Levilized Costs of Wind 2021 Component Breakdown. A) Breakdown of total costs B) Breakdown of “Other Capex” in chart A
Observations
Financial costs are NOT the costs of borrowing on the original investment. The biggest element is cost contingency, followed by commissioning costs. Therefore, I assume that the likely long-term rise interest rates will impact the whole levilized cost.
Costs of turbines are a small part of the difference in costs.
Unsurprisingly, operating cost, including maintenance, are significantly higher out at sea than on land. Similarly for assembly & installation and for electrical infrastructure.
My big surprise is how much greater the cost of foundations are for a floating wind turbine are than a fixed offshore wind turbine. This needs further investigation. In the North Sea there is plenty of experience of floating massive objects with oil rigs, so the technology is not completely new.
What about the batteries?
The above issues may be trivial compared to the issue of “battery” storage for when 100% of electricity comes from renewables, for when the son don’t shine and the wind don’t blow. This is particularly true in the UK when there can be a few day of no wind, or even a few weeks of well below average wind. Interconnectors will help somewhat, but it is likely that neighbouring countries could be experiencing similar weather systems, so might not have any spare. This requires considerable storage of electricity. How much will depend on the excess renewables capacity, the variability weather systems relative to demand, and the acceptable risk of blackouts, or of leaving less essential users with limited or no power. As a ballpark estimate, I will assume 10 days of winter storage. 1500 TWh of annual usage gives 171 GW per hour on average. In winter this might be 200 GW per hour, or 48000 GWh for 10 or 48 million Mwh. The problem is how much would this cost?
In April 2023 it a 30 MWh storage system was announced costing £11 million. This was followed in May by a 99 MWh system costing £30 million. These respectively cost £367,000 and £333,000 per MWh. I will assume there will be considerable cost savings in scaling this up, with a cost of £100,000 per MWh. Multiplying this by 48,000,000 gives a cost estimate of £4.8 trillion, or nearly twice the 2022 UK GDP of £2.5 trillion. If one assumes a 25 year life of these storage facilities, this gives a more “modest” £192 billion annual cost. If this is divided by an annual usage of 1500 TWh it comes out at a cost of 12.8p KWh. These costs could be higher if interest rates are higher. The £192 billion costs are more than the 2023/24 NHS Budget.
This storage requirement could be conservative. On the other hand, if overall energy demand is much lower, due to energy being unaffordable it could be somewhat less. Without fossil fuel backup, there will be a compromise between costs energy storage and rationing with the risk of blackouts.
Calculating the risks
The approach of putting out a report with grandiose claims based on a number of assumptions, then expecting the public to accept those claims as gospel is just not good enough. There are risks that need to be quantified. Then, as a project progresses these risks can be managed, so the desired objectives are achieved in a timely manner using the least resources possible. These are things that ought to be rigorously reviewed before a project is adopted, learning from past experience and drawing on professionals in a number of disciplines. As noted above, there are a number of assumptions made where there are risks of cost overruns and/or shortfalls in claimed delivery. However, the biggest risks come from the law of diminishing marginal returns, a concept that has been understood for over 200 years. For offshore wind the optimal sites will be chosen first. Subsequent sites for a given technology will become more expensive per unit of output. There is also the technical issue of increased numbers of wind turbines having a braking effect on wind speeds, especially under stable conditions.
Concluding Comments
Technically, the answer to the question “could Britain’s energy demand be met entirely by wind and solar?” is in the affirmative, but not nearly so positively at the Smith School makes out. There are underlying technical assumptions that will likely not be borne out with further investigations. However, in terms of costs and reliable power output, the answer is strongly in the negative. This is an example of where rigorous review is needed before accepting policy proposals into the public arena. After all, the broader justification of contributing towards preventing “dangerous climate change” is upheld in that an active global net zero policy does not exist. Therefore, the only justification is on the basis of being net beneficial to the UK. From the above analysis, this is certainly not the case.
Good example of the key logical error in climate policy justifications is illustrated by an article posed in a Los Angeles Times article and repeated by Prof. Roger Pielke Jnr on Twitter. This error completely undermines the case for cutting greenhouse gas emissions.
The question is
What’s more important: Keeping the lights on 24 hours a day, 365 days a year, or solving the climate crisis?
What’s more important: Keeping the lights on 24 hours a day, 365 days a year, or solving the climate crisis? https://t.co/arCgxIX6Wl
It looks to be a trade-off question. But is it a real trade-off?
Before going further I will make some key assumptions for the purposes of this exercise. This is simply to focus in on the key issue.
There is an increasing human-caused climate crisis, that will only get much worse, unless…
Human greenhouse gas (GHG) emissions are cut to zero in the next few decades.
The only costs of solving the climate crisis to the people of California are the few blackouts every year. This will remain fixed into the future. So the fact that California’s electricity costs are substantially higher than the US national average I shall assume for this exercise are nothing to do with any particular state climate-related policies.
The relevant greenhouse gases are well-mixed in the atmosphere. Thus the emissions of California, do not sit in a cloud forever above the sunshine state, but are evenly dispersed over the whole of the earth’s atmosphere.
Global GHG emissions are the aggregate emissions of all nation states (plus international emissions from sea and air). The United States’ GHG emissions are the aggregate emissions of all its member states.
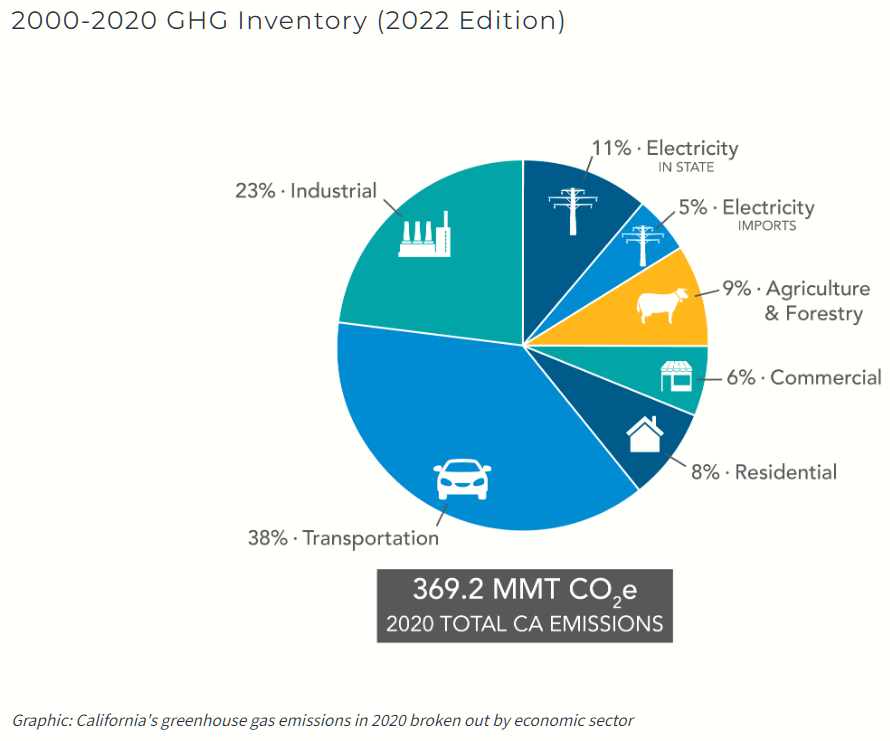
Let us put the blackouts in context. The State of California has a helpful graphic showing a breakdown of the state GHG emissions.
Figure 1: California’s greenhouse gas emissions in 2020 broken out by economic sector
Electricity production, including imports, accounts for just 16% of California’s GHG emissions or about 60 MMtCO2e. Globally in 2020 global GHG emissions were just over 50,000 MMtCO2e. So the replacing existing electricity production from fossil fuels with renewables will cut global emissions by 0.12%. Replacing all GHG emissions from other sources will cut global emissions by 0.74%. So California alone cannot solve the climate crisis. There is no direct trade-off, but rather enduring the blackouts (or other costs) for a very marginal impact on climate change for the people of California. These tiny benefits of course will be shared by the 7960 million people who do not live in California.
The error is in believing that California’s climate policies are leading the rest of the planet.
More generally, the error is in assuming that the world follows the “leaders” on climate change. Effectively, the world the rest of the world is assumed to think as the climate consensus. An example is from the UK in March 2007 when then Environment Minister David Miliband was promoting a Climate Bill, that later became the Climate Change Act 2008.
In the last 16 years under the UNFCCC COP process there has been concerted efforts to get all countries to come “onboard”, so that the combined impact of local and country-level sacrifices produces the total benefit of stopping climate change. Has this laudable aim been achieved?
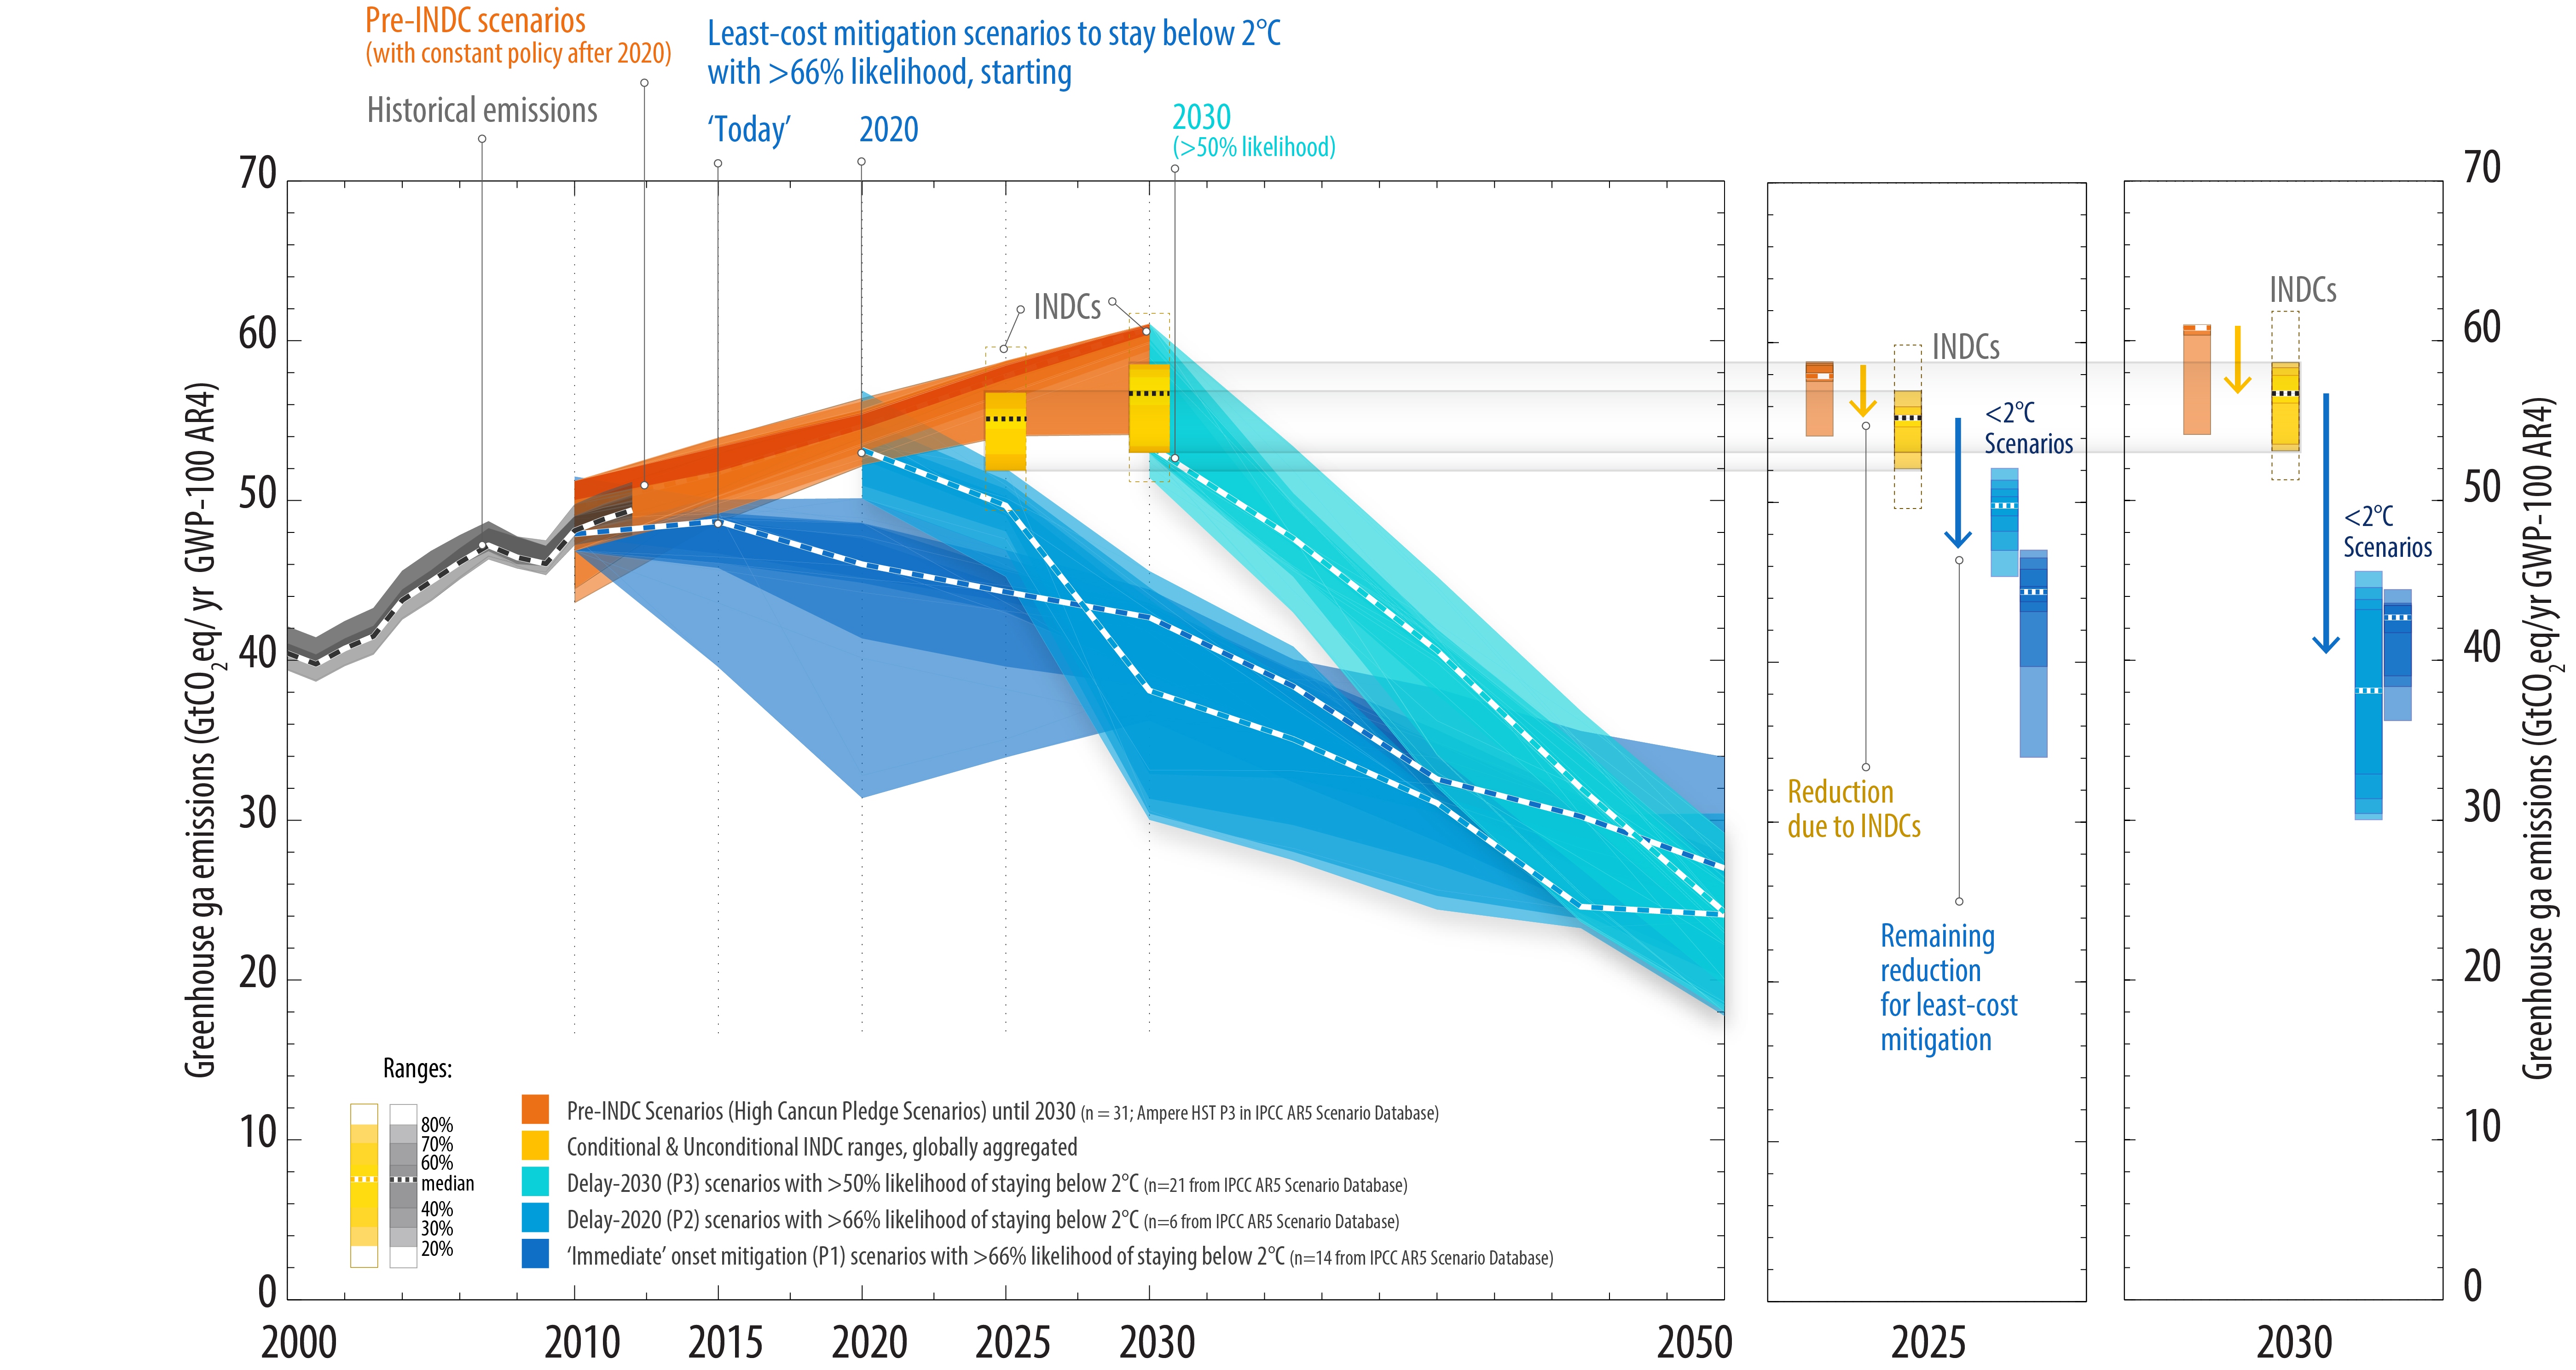
I will just go back to 2015, despite the United Nations Framework Convention on Climate Change Treaty (that set up the UNFCCC body) entering into force in March 1994. In preparation for COP 21 Paris most countries submitted “Intended Nationally Determined Contributions” (INDCs). The submissions outlined what post-2020 climate actions they intended to take under a new international agreement, now called the Paris Agreement. On the 1st November 2015 the UNFCCC produced a Synthesis Report of the aggregate impact of the INDCs submitted up to 1st October. The key chart is reproduced below.
Figure 2 : Summary results on the aggregate effect of INDCs to 1st November 2015.
The aggregate impact is for emissions still to rise through to 2030, with no commitments made thereafter. COP21 Paris failed in it’s objectives of a plan to reduce global emissions as was admitted in the ADOPTION OF THE PARIS AGREEMENT communique of 12/12/2015.
Notes with concern that the estimated aggregate greenhouse gas emission levels in 2025 and 2030 resulting from the intended nationally determined contributions do not fall within least-cost 2 ˚C scenarios but rather lead to a projected level of 55 gigatonnes in 2030, and also notes that much greater emission reduction efforts will be required than those associated with the intended nationally determined contributions in order to hold the increase in the global average temperature to below 2 ˚C above pre-industrial levels by reducing emissions to 40 gigatonnes or to 1.5 ˚C above pre-industrial levels by reducing to a level to be identified in the special report referred to in paragraph 21 below;
Paragraph 21 states
Invites the Intergovernmental Panel on Climate Change to provide a special report in 2018 on the impacts of global warming of 1.5 °C above pre-industrial levels and related global greenhouse gas emission pathways;
The request lead, 32 months later, to the scary IPCC SR1.5 of 2018. The annual COP meetings have also been pushing very hard for massive changes. Has this worked?
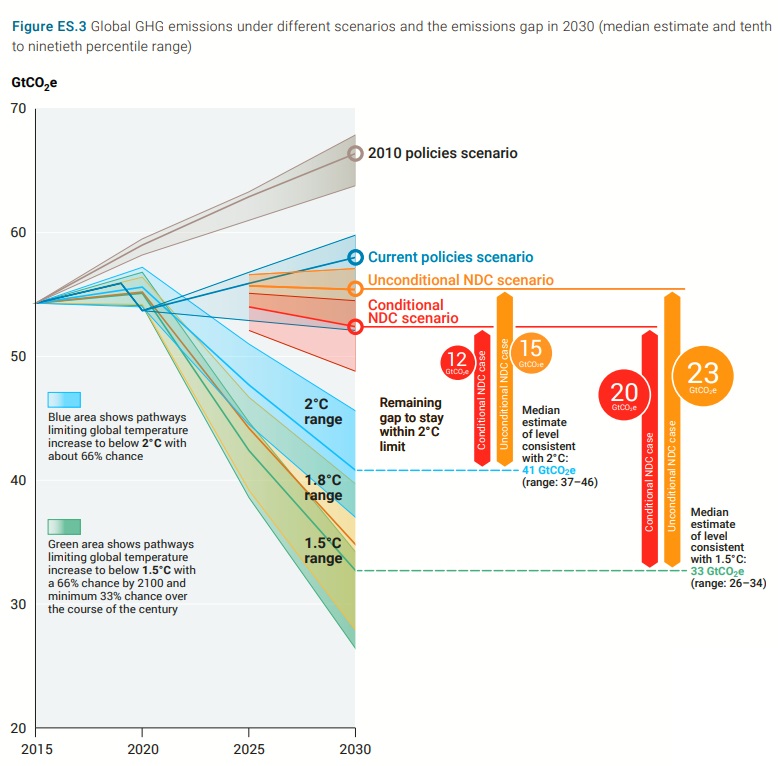
Figure 3 : Fig ES.3 from UNEP Emissions Gap Report 2022 demonstrating that global emissions have not yet peaked
The answer from the UNEP Emissions Gap Report 2022 executive summary Fig ES.3 is a clear negative. The chart, reproduced above as Figure 3, shows that no significant changes have been made to the commitments since 2015, in that aggregate global emissions will still be higher in 2030 than in 2015. Indeed the main estimate is for emissions in 2030 is 58 GtCO2e, up from 55 GtCO2e in 2015. Attempts to control global emissions, hence the climate, have failed.
Thus, in the context of the above assumptions the question for the people of California becomes.
What’s more important: Keeping a useless policy that is causing blackouts, or not?
To help clarify the point, there is a useful analogy with medicine.
If a treatment is not working, but causing harm to the patient, should you cease treatment?
In medicine, like in climate policy, whether or not the diagnosis was correct is irrelevant. Morally it is wrong to administer useless and harmful policies / treatments. However, there will be strong resistance to any form of recognition of the reality that climate mitigation has failed.
Although the failure to reduce emissions at the global level is more than sufficient to nullify any justification for emissions reductions at sub-global levels, there are many other reasons that would further improve the case for a rational policy-maker to completely abandon all climate mitigation policies.
Kevin VS Marshall
Revised 31/07/2023 or July 31st 2023 for US readers
If a fantasy is something impossible, or highly improbable, then I believe that I more than justify the claim concerning the latest BP Energy Outlook. A lot of ground will be covered but will be summarised at the end.
Trigger warning. For those who really believe that current climate policies are about saving the planet, please exit now.
The BP Energy Outlook 2023 was published on 26th June. From the introduction
Energy Outlook 2023 is focused on three main scenarios: Accelerated, Net Zero and New Momentum. These scenarios are not predictions of what is likely to happen or what BP would like to happen. Rather they explore the possible implications of different judgements and assumptions concerning the nature of the energy transition and the uncertainties around those judgements.
One might assume that the order is some sort of ascent, or decent. That is not the case, as New Momentum is the least difficult to achieve, then Accelerated, with Net Zero being the hardest to achieve. The most extreme case is Net Zero. Is this in line with what is known as Net Zero in the UNFCCC COP process? From the UNEP Emissions Gap Report 2018 Executive Summary, major point 2
Global greenhouse gas emissions show no signs of peaking. Global CO2 emissions from energy and industry increased in 2017, following a three-year period of stabilization. Total annual greenhouse gases emissions, including from land-use change, reached a record high of 53.5 GtCO2e in 2017, an increase of 0.7 GtCO2e compared with 2016. In contrast, global GHG emissions in 2030 need to be approximately 25 percent and 55 percent lower than in 2017 to put the world on a least-cost pathway to limiting global warming to 2°C and 1.5°C respectively.
With Net Zero being accomplished for 2°C in 2070 and 1.5°C in 2050, this gives 20 years of 2017 emissions from 2020 for 2°C of warming and just 12 years for 1.5°C. Figure 1 in the BP Energy Outlook 2023 Report, reproduced below, is roughly midway between 12 and 20 years of emissions, although with only about three-quarters of the emissions, in equivalent CO2 tonnes that the UN uses for policy. This seems quite reasonable course to take to keep things simple.
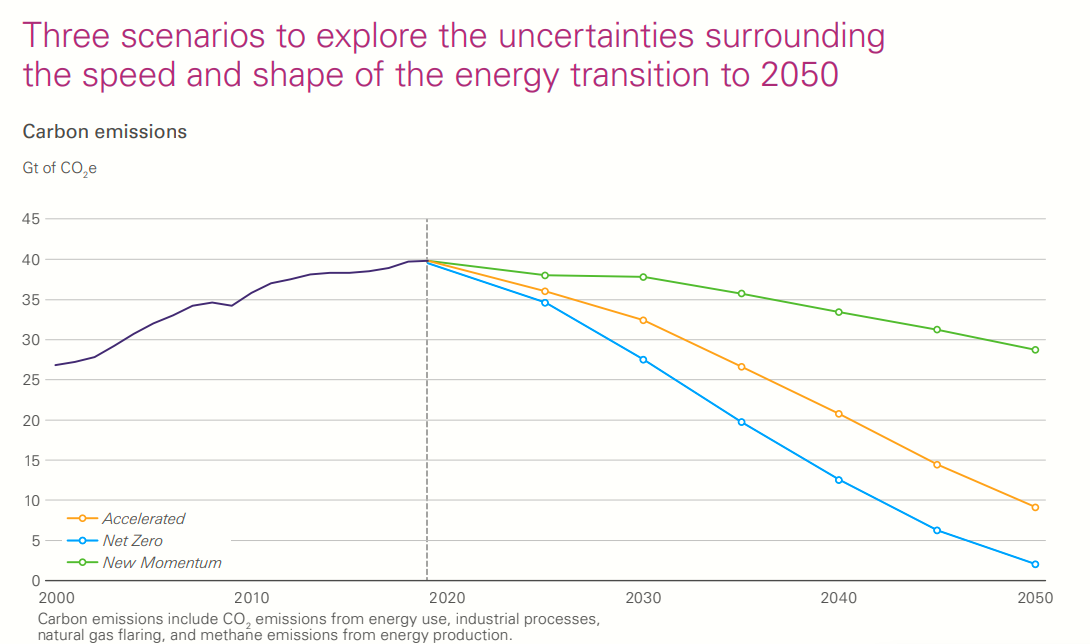
The BP Energy Outlook summarises the emissions pathways in a key chart, reproduced below.
Fig 1 : BP Energy Outlook 2023 scenario projections, with historical emissions up to 2019
One would expect the least onerous scenario would be based on current trends. The description says otherwise.
New Momentum is designed to capture the broad trajectory along which the global energy system is currently travelling. It places weight on the marked increase in global ambition for decarbonization in recent years, as well as on the manner and speed of decarbonization seen over the recent past. CO2e emissions in New Momentum peak in the 2020s and by 2050 are around 30% below 2019 levels.
That is the most realistic scenario based on current global policies is still based on a change in actual policies. How much though? Fig 1 above, shows, actual emissions up to 2019 are increasing, then a decrease in all three scenarios from 2020 onwards.
At Notalotofpeopleknowthat, in an article on this report, the slightly narrower CO2 emissions narrow CO2 emissions are shown.
There was a significant drop in emissions in 2020 due to covid lockdowns, but emissions more than recovered to break new records in 2022. But all scenarios in Fig 1 show a decline in emissions from 2019 to 2025. Neither do emissions show signs of peaking? The UNEP Emissions GAP Report 2022 forecasts that GHG emissions (the broadest measure of emissions) could be up to 9% higher than in 2017, with a near zero chance of being the same. The key emissions gap chart is reproduced in Fig 3.
Fig 3. Emissions gap chart ES.3 from UNEP Emissions Gap Report 2022
Clearly under current policies global GHG emissions will rise this decade. The “new momentum” was nowhere in sight last October, nor was there any sight of emissions peaking after COP27 at Sharm el-Sheikh in December. Nor is there any real prospect of that happening at COP28 in United Arab Emirates (an oil state) later this year.
Yet even this chart is flawed. The 2°C main target for 2030 is 41 GtCO2e and the 1.5°C main target is 33 GtCO2e. Both are not centred in their ranges. From the EGR 2018, a 25% reduction on 53.5 is 40, and a 55% reduction 24. But at least there is some pretence of trying to reconcile desired policy with the most probable reality.
It gets worse…
In the lead-up to COP21 Paris 2015 countries submitted “Intended Nationally Determined Contributions” (INDCs). The UNFCCC said thank you and filed them. There appears to be no review or rejection of any INDCs that clearly violated the global objective of substantially reducing global greenhouse gas emissions by 2030. Thus an INDC was not rejected in the contribution was highly negative. That is if the target implied massively increasing emissions. The major example of this is China. Their top targets of peaking CO2 emissions around 2030 & “to lower carbon dioxide emissions per unit of GDP by 60% to 65% from the 2005 level” (page 21) can be achieved even if emissions more than double between 2015 and 2030. This is simply based on the 1990-2010 GDP average growth of 10% and the emissions growth of 6%. Both India and Turkey (page 5) plan to double emissions in the same period. (page 5) and Pakistan to quadruple theirs (page 26). Iran plans to cut its emissions by 4% up to 2030 compared with a BAU scenario. Which is some sort of increase.
There are plenty of other non-OECD countries planning to increase their emissions. As of mid-2023 no major country seems to have reversed course. Why is this important? The answer lies in a combination of the Paris Agreement & the data
The flaw in the Paris Agreement
Although nearly every country has signed the Paris Agreement, few have understood its real lack of teeth in gaining reductions in global emissions. Article 4.1 states
In order to achieve the long-term temperature goal set out in Article 2, Parties aim to reach global peaking of greenhouse gas emissions as soon as possible, recognizing that peaking will take longer for developing country Parties, and to undertake rapid reductions thereafter in accordance with best available science, so as to achieve a balance between anthropogenic emissions by sources and removals by sinks of greenhouse gases in the second half of this century, on the basis of equity, and in the context of sustainable development and efforts to eradicate poverty.
The agreement lacks any firm commitments but does make a clear distinction between developed and developing countries. The latter countries have no obligation even to slow down emissions growth in the near future. Furthermore, the “developed” countries are quite small in population. These are basically all the members of the OECD. This includes some of the upper middle-income countries like Turkey, Costa Rica and Columbia, but excludes the small Gulf States with very high per capita incomes.
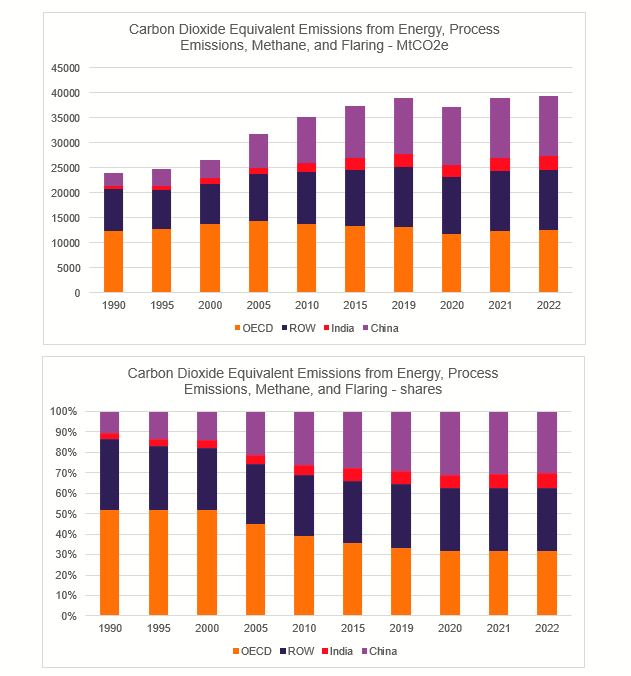
BP is perhaps better known for its annual Statistical Review of World Energy. The 2023 edition was published on the same day as the Energy Outlook but for the first time by the Energy Institute. From this, I have used the CO2 emissions data to split out the world emissions into four groups – OECD, China, India, and Rest of the World. The OECD countries collectively have a population of about 1.38bn, or about the same as India or China.
Fig 4: Global Emissions from the Energy Institute Statistical Review of World Energy 2023 shown in MtCO2e and shares.
From 1990 to 2022, OECD countries increased their emissions by 1%, India by 320%, China by 370% and ROW by 45%. As a result the OECD share of global emissions fell from 52% in 1990 to 32%. Even if all the non-OECD countries kept the emissions constant in the 2020s, the 2°C target could only be achieved by OECD countries reducing their emissions by nearly 80% and for the 1.5°C target by over 170%. The reality is that obtaining deep global emissions cuts are about as much fantasy as believing an Official Monster Raving Loony Party candidate could win a seat in the House of Commons. Their electoral record is here.
The forgotten element….
By 2050, we find that nearly 60 per cent of oil and fossil methane gas, and 90 per cent of coal must remain unextracted to keep within a 1.5 °C carbon budget.
Welsby, D., Price, J., Pye, S. et al. Unextractable fossil fuels in a 1.5 °C world. Nature597, 230–234 (2021).
It has been estimated that to have at least a 50 per cent chance of keeping warming below 2°C throughout the twenty-first century, the cumulative carbon emissions between 2011 and 2050 need to be limited to around 1,100 gigatonnes of carbon dioxide (Gt CO2). However, the greenhouse gas emissions contained in present estimates of global fossil fuel reserves are around three times higher than this, and so the unabated use of all current fossil fuel reserves is incompatible with a warming limit of 2°C
McGlade, C., Ekins, P. The geographical distribution of fossil fuels unused when limiting global warming to 2 °C. Nature517, 187–190 (2015).
I am not aware of any global agreement to keep most of the considerable reserves of fossil fuels in the ground. Yet is clear from these two papers that meeting climate objectives requires this. Of course, the authors of the BP Energy Outlook may not be aware of these papers. But they will be aware of the Statistical Review of World Energy. It has estimates of reserves for oil, gas, and coal. They have not been updated for two years, but there are around 50 years of gas & oil and well over 100 years of coal left. Once
Key points covered
Energy Outlook scenarios do not include an unchanged policy
All three scenarios show a decline between 2019 & 2025. 2022 actual emissions were higher than 2019.
In aggregate Paris climate commitments mean an increase emissions by 2030, something ignored by the scenarios.
The Paris Agreement exempts developing countries from even curbing their emissions growth in the near term. Accounting for virtually all the emissions growth since 1990 and around two-thirds of current emissions makes significantly reducing global emissions quite impossible.
Then totally bypassing the policy issue of keeping most of the available fossil fuels in the ground.
Given all the above labelling the BP Energy Outlook 2023 scenarios “fantasies” is quite mild. Even though they may be theoretically possible there is no general recognition of the policy constraints which would lead to action plans to overcome these constraints. But in the COP process and amongst activists around the world there is just a belief that proclaiming the need for policy will achieve a global transformation.
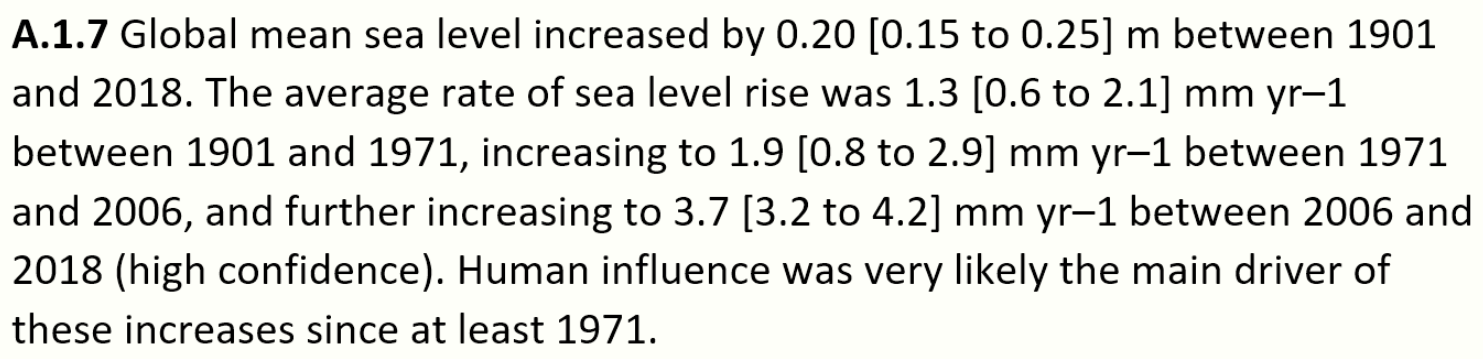
UNIPCC AGR6 WG1 SPM page 5 makes the following highly misleading claim about sea level rise acceleration.
Below is why this statement is highly misleading.
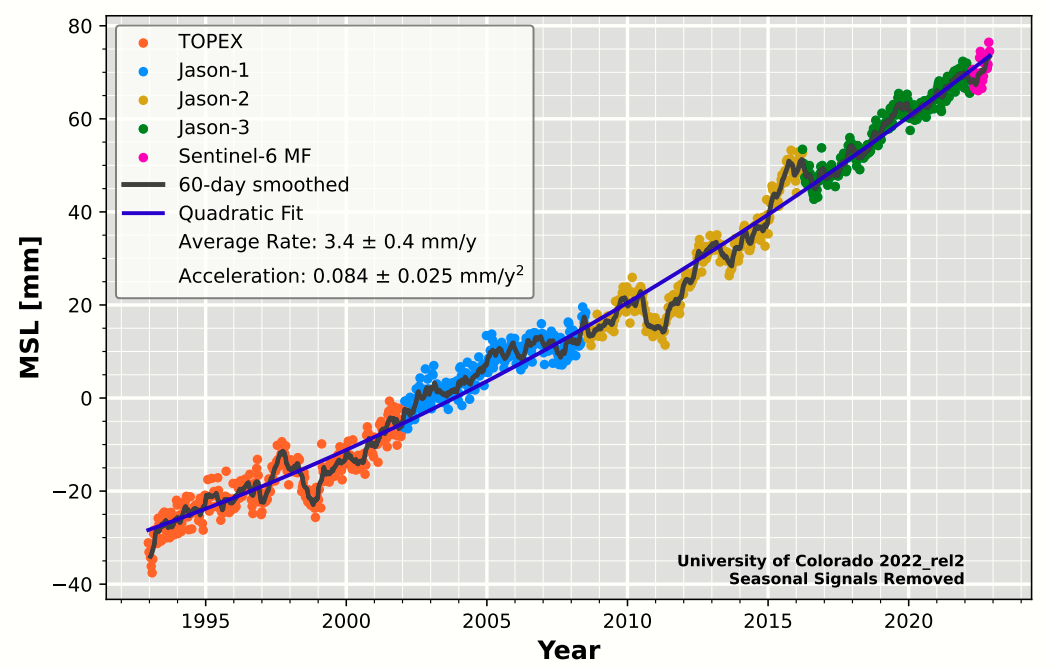
1. In 1993 there was a switch in sea level rise measurements from tide gauges to satellites. The data for the latter is available from University of Colorado Sea Level Research Group. The main graph is below.
2. From the data the average sea levels in 2018 were 43.8mm higher than in 2006. An average rise of 3.65mm yr-1. Rounded this is the IPCC’s 3.7mm yr-1
3. From the satellites from 1993 to 2006 sea levels rose by 37.5mm or 2.9mm yr-1. From the IPCC sea levels rose by 1.9 mm yr-1 from 1971 to 2006 or 66.5mm yr-1. Therefore from 1971 to 1993 from tide gauge data sea levels rose 29mm in 22 years or 1.32mm yr-1.
4. Simply by switching the method of calculating level rise from some averages of tide gauges to satellite observations doubles the rate of sea level rise. That is most apparent sea level rise acceleration is not in actual measurement. But how robust is the satellite data set?
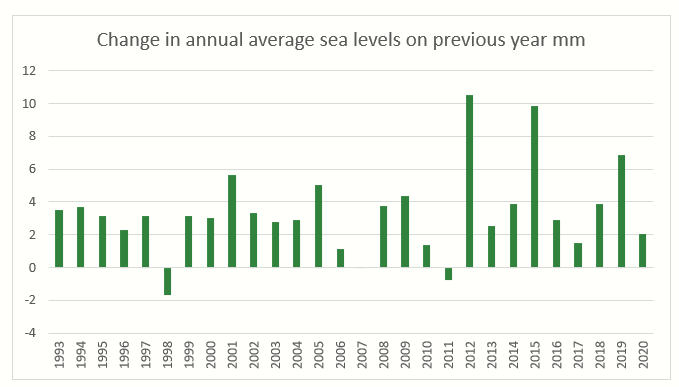
5. The data I downloaded for the satellite tide data set was from Dec 1992 to Jul 2021. Sea levels rose by around 100.31mm in this period or nearly 4 inches. However, there are considerable changes from year to year. In the 28.5 years, the annual average of rate of rise was 3.5mm, but the rise in individual years varied from a fall of 1.65mm in 1998 to a rise 10.54mm in 2012. See Figure 2. The question is whether these changes are real or due to estimates.
Figure 2 – Change in annual average sea levels on previous year mm from the satellite sea level data set.
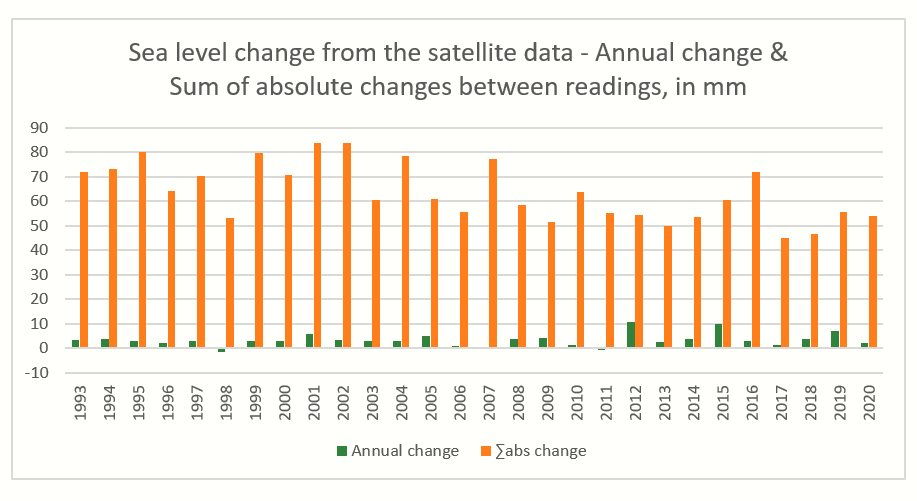
6. Actual readings are about 10 days apart, yet have significant differences from one to another both up and down. The average change between readings is 1.8mm or an absolute change of 1821mm or 18 times the net change. Figure 3 compares this with the net changes.
Figure 3 – Annual change & Sum of absolute changes between readings from the satellite data.
7. Given that in the satellite data there is a small apparent acceleration of sea level rise in 28 years when total rise was 100mm or 1/18 of absolute changes in sea level from one reading to another, and given satellites give at least 2x the rate of rise as tide gauges how can anyone claim using that data that sea level rise is accelerating? With individual tide gauges there is at least a control over time as they are in fixed place, but where is the control from the satellite data? Especially given that the sea level varies by many metres across the surface of the earth and that the satellite data gives a completely different set of results to the tide gauges.
8. Regardless of whether the satellite data and the tide gauges give good estimates, the fact that they give significantly results means that splicing together is misleading.
9. The statement about sea level rise is at the summary level. One would expect in the full WG1 report to repeat this claim, then give some sort of justification for the splicing together of two datasets with quite different estimates. The relevant section is Chapter 9.6, starting on numbered page 1287, or pdf sheet 1304 of the full report, or pdf sheet 77 of the Chapter 9 download. I can find no restatement nor justification for the splicing two different data sets together, nor any explicit recognition that the two measures are quite different. The discussion of each set is in separate sections 9.6.1.1 & 9.6.1.2, but nothing to reconcile the two.
10. There is a claim of acceleration in tide gauge average seal levels in the period 1901 to 2010, despite there being no discernible acceleration in the calculated figure for 1901 to 1992 in the SPM statement.1 But what does confining estimates of acceleration in the tide gauges to saying it was 1902–2010 (–0.002 to +0.019 mm yr–2) miss out?
Even acceleration of +0.01 mm yr-2 is compatible with 1.3 mm yr-1 for both 1901-1971 and & 1971-1993, but not +0.019 mm yr–2.
Top of the range acceleration of +0.019 mm yr–2 from 1902–2010 still leaves rates of sea level rise for the period 1993-2010 well below that of the satellites for the period 1993-2010.
Quoting the same acceleration for the whole period 1902-2010 suggests that the data does not show significantly increased rates of sea level rise after 1990. If there was an increase in acceleration in the rate sea level in line with satellite measurements surely a report trying to demonstrate human-caused climate change would highlight this. After all, the rate of rise in CO2 levels accelerated in the late 1950s when Mauna Loa CO2 levels started to be recorded and the current warming phase only started in the late 1970s.
The range –0.002 to +0.019 mm yr–2 includes zero. That is the data estimated range includes the null hypothesis that there was no acceleration in sea level rise in the period 1902–2010. For normal science this is a grave issue, but for post-normal science (based on a priori beliefs) it is irrelevant.
Concluding comments
The claim of accelerating sea level rise in UNIPCC AGR6 WG1 SPM is mostly based upon splicing together two different data sets. There is no attempt within the detailed report to justify this splicing. Further, the sea level rise acceleration estimate range from the tide gauges does not exclude zero, whilst the upper range does not allow convergence with the satellite data. Most of the implied acceleration in AR6 WG1 SPM Para A.1.7 is grossly misleading propaganda.
Notes
“The SROCC found that four of the five available tide gauge reconstructions that extend back to at least 1902 showed a robust acceleration (high confidence) of GMSL rise over the 20th century, with estimates for the period 1902–2010 (–0.002 to +0.019 mm yr–2) that were consistent with AR5. New tide gauge reconstructions published since SROCC (Dangendorf et al., 2019; Frederikse et al., 2020b) support this assessment and suggest that increased ocean heat uptake related to changes in Southern Hemisphere winds and increased mass loss from Greenland are the primary physical mechanisms for the acceleration (Section 2.3.3.3). Therefore, the SROCC assessment on the acceleration of GMSL rise over the 20th century is maintained.” (9.6.1.1 page 1287)


