Evangelical Christians and Climate Change Skepticism

Wm Briggs reports on a “forthcoming Bulletin of the American Meteorological Society paper “Making the climate a part of the human world”, in which University of British Columbia geographer Simon Donner argues that religion is the cause of global warming denial. ” (Pre-publication copy here)

Simon Donner’s Views

Donner’s Summary is

“Ongoing public uncertainty about climate change is rooted in a perceived conflict between the scientific evidence for a human role in the climate and a common belief that the weather and climate are controlled by higher powers.”

This is backed up by a number of studies of religions, both ancient and primitive religions from various parts of the world. This includes from Fiji and Papua New Guinea. I can find no reference to the major religions of Islam, Hinduism or Buddhism. There is only one biblical reference, from the Old Testament book of Job, but none from the New Testament – the stories about Jesus and his disciples. Neither is there a distinction between Catholicism and Protestantism, nor a split between evangelical and liberal protestants.

The Religious Sceptics in USA

The majority of the religious sceptics in the USA are the Protestant Evangelicals. Their type of Christianity is centred on biblical study, both individually and corporately, to perceive the revealed word of God and the interpretation for current circumstances. There are the specialists – the ordained pastors – who provide interpretations through sermons. However, this is just the lead for personal study and reflection.

Collectively, these evangelicals are not unified body theologically. For instance, a quick comparison of the Southern Baptist Convention and the Assemblies of God websites will quickly demonstrate the point. Nor are there strong ecumenical links between the major churches, as found in Britain.

This bible-based view of Christianity comes directly from the Reformation. In medieval Europe the Bible was handwritten and only available in Latin. With most people illiterate, reading of the Bible was limited to a few dedicated scholars, with interpretation highly centralised and strictly controlled. Any deviation was treated as heresy, often punishable by death. A combination of the advent of printing and translation into the vernacular suddenly made the word of God accessible to a much wider population. It soon became evident that the established religious orthodoxy was, in many places, unsupported from the sacred text and in some cases fundamentally at odds with that text. It was this need to study that changed public worship so dramatically, with teaching replacing the Mass as the centrepiece.

Politically, access to the Bible democratised understanding and the questioning of authority and centralised power. This gave a scholarly impetus to the development of modern science, and also the Liberal political philosophy of John Locke and the Scottish Enlightenment that in turn heavily influenced the Founding Fathers.

An Alternative Thesis

Evangelicals have as their primary resource the Bible and the interpretation of God’s purpose from within their local congregation. Your average church member will have quite a detailed knowledge of the Bible, being able to quote much of the primary doctrine and some major passages. Generally they also “cherish and defend religious liberty, and deny the right of any secular or religious authority to impose a confession of faith upon a church or body of churches.
(Southern Baptist Convention). The scepticism towards climate change comes from its presentation. It comes across as a core doctrine that is agreed upon by a consensus of leading scientists. But the truth cannot be perceived by the lay person, but only revealed by impenetrable computer models to scientific experts. Any deviation or questioning of core doctrine is treated with contempt and as a heresy. Yet the high scientific standards that these experts are supposed to follow has been found wanting. There are two areas where this is demonstrated most.

First, the poster hockey stick of a decade ago – showing global temperatures were dramatically higher than at an time in the last millennium – was investigated by the Steve McIntyre. He showed the results were as a result of a number of elements including cherry picking data; giving undue weighting to favourable results; excluding some unfavourable data points; failing to apply proper statistical tests. A book charting this episode is found here, and my comparison of an exchange following a savage book review is here.

Second is the Climategate email release, which showed that the core scientists were a fairly small group, that they viewed the science as far from settled, and they adhered to lower standards of scholarship than was the public perception.

The Inferences from the Donner Paper

Donner has either little understanding of mainstream Christianity in the USA, or he deliberately misrepresents what it stands for. In so doing, he not only completely misses the point of why religious Americans are sceptical but does so in such a way that will make them more antagonistic. The fact that peer review should allow through a paper that clearly does not have proper argument to support the thesis shows a failure to of that process. That a person with no qualifications or prior publishing record in the field of sociology or theology should be allowed to publish on the subject in a journal specialising in the weather shows how far climate science is straying beyond its area of competency. For Christians who unsure of the global warming arguments, clear evidence that a climate scientist not knowing what they are talking about will make them more sceptical. They will be more likely to accept the sceptical comments that the science is flawed, whether the theory, the computer models or the statistics.

Tamino on Australian Sea-Levels

Tamino attempts a hatchet-job on a peer-reviewed paper on Australian Sea Levels. Whilst making some valid comments, it gives the misleading impression that he has overturned the main conclusion.

The sceptic blogs (GWPF, Wattsupwiththat, Jo Nova) are highlighting a front page article in the Australian about a peer-reviewed paper by P.J. Watson about Australian sea levels trends over the past century.

The major conclusion is that:-

“The analysis reveals a consistent trend of weak deceleration at each of these gauge sites throughout Australasia over the period from 1940 to 2000. Short period trends of acceleration in mean sea level after 1990 are evident at each site, although these are not abnormal or higher than other short-term rates measured throughout the historical record.”

The significance is that Watson shows a twentieth century rise of 17cm +/-5cm in Australia, whilst Government policy is based a sea level rise of up to 90cm by the end of the century. If there is deceleration from an already low base, then government action is no longer required, potentially saving billions of dollars.

Looking for other viewpoints I found a direction from Real Climate to Tamino’s Open Mind blog. Given my last encounter when he tried to defend the deeply flawed Hockey Stick (see my comments here and here) I curious to know if this was another misdirection. I was not disappointed. Tamino manages to produce a graph showing the opposite to Watson. That is rapid acceleration, not gentle deceleration.

How does he end up with this contrary result? In Summary

  1. Chooses just one of the four data sets used. That is the Freemantle data set.
  2. Making valid, but largely irrelevant criticisms, to undermine the scientific and statistical competency of the author.
  3. Takes time to make the point about treating 20 year moving averages as data for analysis purposes. The problem is that it underweights the data points at the beginning and the end. In particular, any recent acceleration will be understated.
  4. Criticizes the modelling method, with good reasons.
  5. Slips in an alternative model that may answer that criticism.
  6. Shows the results of that model output.

Tamino’s choice of the Freemantle data set should be justified, especially as Watson gives the comment in the conclusion.

“There is evidence of significant mine subsidence embedded in the historical tide gauge record for Newcastle and a likelihood of inferred subsidence within the later (after the mid 1990s) portion of the Fremantle record. In this respect, it is timely and necessary to augment these relative tide gauge measurements with CGPS to gain accurate data on the vertical movement (if any) at each gauge site to measure eustatic sea level rise. At present only the Auckland gauge is fitted with such precision levelling technology.”

That is, the Freemantle data shows the largest acceleration towards the end and this extra acceleration might be because land levels are falling, not sea levels rising.

The underweighting of recent data is important and could be dealt with by looking at shorter period moving averages and observing the acceleration rates. That is looking at moving averages for 19, 18, 17 years etc. If the acceleration rates cross the 20cm a century rate with the shortening of the time periods then this will undermine Watson’s conclusion. Tamino does not do this, despite being well within his capabilities. Until such an analysis is carried out, the claim abstract in the abstract that “(s)hort period trends of acceleration in mean sea level after 1990 … are not abnormal or higher than other short-term rates measured throughout the historical record ” is not undermined.

Instead of pursuing the point, Tamino then goes on to substitute Watson’s modelling method for an arbitrary one plucked from the air, with the comment

“Finally, we come to the other very big problem with this analysis: the model itself. Watson models his data as a quadratic function of time:

.

He then uses  (the 2nd time derivative of the model) as the estimated acceleration. But this model assumes that the acceleration is constant throughout the observed time span. That’s clearly not so. ”

Instead he flippantly inserts a quartic equation, which gives the time-varying acceleration (the second derivation) as a quadratic function against time.

There are some problems with a quadratic functions as a model against time. Primarily it only has one turning point. Extend the graph far enough and it reaches infinity. So at some point in the future sea levels will reach the sun, and later the rate of rise will be faster than the speed of light. More seriously, if this quadratic is the closest fit to all the data series, it will either have, or soon will have, overstated the actual acceleration. If used to project 90 years or more ahead, it will provide a grossly exaggerated projection based on known data.

On this basis I have edited to give all the inferences that can be drawn from rising sea levels in Australasia.
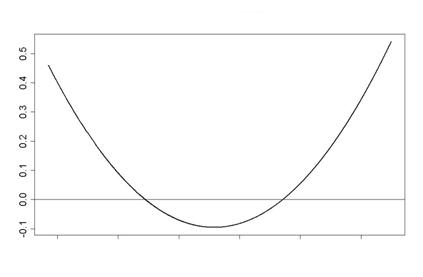
That is, a pure maths exercise in plotting a quadratic equation on a graph, unrelated to any reality.

An alternative to this is to claim simply that there is not sufficient valid data, or the analysis is too poor draw any long-term inferences.

An alternative approach is to relate the sea level rises to the global temperature rises. Try comparing Watson’s graph of rate of change in sea levels to the two major temperature anomalies.

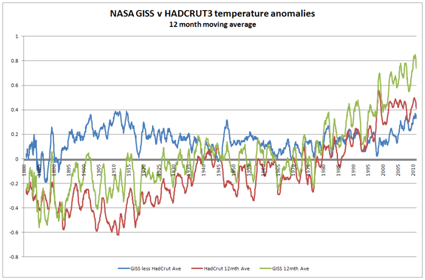

First it should be pointed out that Watson uses a twenty year moving average, so his data should lag the temperature data. The strong warming in the HADCRUT data in the 1920s to 1940s is replicated in Fort Denison and Auckland sea level data. The Lack of warming in the 1945 to 1975 period is replicated be marked deceleration in all four data sets from 1950 to the 1970s. The warming phase thereafter is similarly replicated in all four data sets. The current static phase, according to the more reliable HADCRUT data, should similarly be marked by a deceleration in sea level rise from an already low level. Further analysis of Watson’s data is needed to confirm this.

There is no reason in the existing data to believe that Watson’s conclusions are invalid. It is necessary to play fast and loose with the data and get lost in computer games models to draw alternative inferences. Yet if a member of the Australian Parliament says legislation to cope with sea level rise should be withdrawn due to a new study, the alarmist consensus, (who have just skimmed through Tamino’s debunking), will say that the study has been overturned. As a result, ordinary, coastal-dwelling people in Australia will continue to endure real hardship due to legislation based on alarmist exaggerations. (here & here).

Outflanking Al Gore & other alarmists

At Wattupwiththat there is a proposal to build a database by

Find(ing) every false, misleading, scary, idiotic, non-scientific statement they have made in the past twenty years. Create an index by name with pages listing those statement with links to the source. Keep it factual. Let their own words come back to haunt them.

My comment was

A database of all the exaggerations, errors and false prophesies on its own will do no good. No matter how extensive and thorough and rigorous, it will be dismissed as having been compiled by serial deniers funded by big oil. Getting a fair hearing in the MSM will be impossible. It the coming battle the alarmists have decided the field of battle and have impenetrable armour.

To be brief, there needs to be two analogies brought to the fore.

First is the legal analogy. If there is a case for CAGW, it must be demonstrated by primary, empirical evidence. That evidence must be tested by opponents. It is not the bits, that may be true – like lots more CO2 will cause some warming. But that there is sufficient CO2 to cause some warming, which will be magnified by positive feedbacks to cause even greater warming, and this substantive warming will destabilize the planet weather systems in a highly negative way. The counter-argument is two-fold – that many of dire, immediate, forecasts have been highly exaggerated and more importantly, the compound uncertainties that have been vastly underestimated. That the case is weak is shown by the prominence given to what is hearsay evidence, such as the consensus, or the proclamations of groups of scientists, or to the image of the hockey stick. In some cases, it has been tantamount to jury-tampering.

Second is the medical analogy. A medical doctor, in proscribing a painful and potentially harmful course of treatment, should at last have a strong professionally-based expectation that post treatment the patient will be better off than if nothing was done. The very qualities that make politicians electable – of being able to make build coalitions by fudging, projecting an image, and undermining the opponents by polarizing views – make them patently unfit for driving through and micro-managing effective policy to reduce CO2. They will of necessity overstate the benefits and massively understate the costs, whether financial or in human suffering. They will not admit that the problem is beyond their capabilities, nor that errors had been made. The problem is even worse in powerful dictatorships than democracies.

I have tried to suggest a method (for those who are familiar with microeconomics) the IPCC/Stern case for containing CO2 here.

https://manicbeancounter.wordpress.com/2011/02/11/climate-change-policy-in-perspective-%E2%80%93-part-1-of-4/

Also, why there is no effective, global political solution possible.

https://manicbeancounter.wordpress.com/2011/02/13/climate-change-in-perspective-%E2%80%93-part-2-of-4-the-mitigation-curve/

What is missing is why the costs of global warming have been grossly exaggerated.

Keynes, Hayek and Global Warming

Jo Nova points to the excellent Keynes versus Hayek rap videos and compares with global warming views. My own observations are more to do with the nature of theory.

To compare Keynes & Hayek, I believe that we need to separate Keynes from the mainstream Keynesians. Keynes saw theory as a means to get the policy he wanted. It was the Keynesians (starting with John Hicks’ IS-LM analysis) that started the modelling approach. Both Keynes and Hayek eschewed the mathematical modelling of modern economics. In this Keynes would be closer to the perspective of GLS Shackle than Keynesians

  1. Keynes saw the economic system as being essentially unstable. There was no tendency for the economic system to tend towards an optimal equilibrium. Rather it could get stuck for long periods with high unemployment. This seems to parallel to the notion of tipping points. The Keynesian multiplier The parallel in CAGW theory can be seen in the positive feedbacks and tipping points. When Bob Carter says that climate is homeostatic (or Warren Meyer at climate-skeptic uses his ball in a bowl illustration), they criticize the climate models for being Keynesian. I would think that the Carter/Meyer view of climate is similar to that of Hayek on economic phenomena. Climate is essentially chaotic, having only general empirical regularities. However, it has tendencies towards equilibrium. Please note that Hayek occupies a position close to Keynes this issue. Walrasian General Equilibrium with perfect knowledge and instantaneous leaps from one equilibrium to another is an extreme caricature of more mainstream economics. Here Keynes v. Hayek is more apt for the views on climate.
  2. Keynesians view all the essential features of the economic system as being essentially knowable, capable of being reasonably represented in mathematical models. Hayek calls this a “pretence of knowledge” (the title of his Nobel Prize lecture), as although we may know essential features of the system, the relationships are highly complex and changing. The problem is not just lack of measurement, it is having data that is capable of being modelled in order make manipulation of these variables possible. In economics, the manipulation is control of macro economy. In climate, it is to control the global average temperature.
  3. Keynesians believe that a few major measures are sufficient to describe an economy. CAGW theorists believe that the global surface temperature and atmospheric CO2 are key measures. Hayek questioned whether such variables were meaningful. CAGW theorists are on much shakier ground than the Keynesians here. Bob Carter points out in his book that the stored heat in the atmosphere is a tiny fraction of that stored in the oceans. When it comes to stored CO2 the problems are even greater.

But when it comes to the rhetoric of global warming, the analogy should not be with Keynes, but with Karl Marx. Climate models give true scientists perfect insight into the real nature of climate. Those who are on the outside are delusional and/or are either knowingly, or subconsciously, acting as lackeys of the oppressive class. In Marx the oppressive class are the bourgeois, in climate alarmism they are Big Oil.

British-Irish Council taken over by Climate Alarmists?

The Irish Times has carried a report that

THE BRITISH government could massively subsidise the Irish wind energy industry under proposals to be considered in London today.

Would that be the same British Government who are struggling to control a record budget deficit? A Government that presides over a territory which is in many parts extremely windy. Where would these windmills be located? The proposal would be offshore. So the UK is a short of coastline then?

Who put forward this proposal? The famous British-Irish Council. Their website is here.

And here is a screen-shot of that homepage.

It strikes as a little odd that the website should be hosted in Jersey. Or if you do a Google search you will find lots of references to renewable energy and the Isle of Man. Promoting the minor islands and wind power would be a major part of its’ purpose then?

To quote the website

Priority areas of work

At its first summit in London in December 1999, the council decided on a number of priority areas of work which would benefit from such co-operation. While the list is not exhaustive, it includes:

  • agricultural issues
  • health
  • regional issues
  • consideration of inter-parliamentary links
  • energy
  • cultural issues
  • tourism
  • sporting activity
  • education
  • approaches to EU issues
  • minority and lesser used languages
  • prison and probation issues

    So that would be a no then.

    It would seem that the original purpose of the British-Irish Council has been lost and that the organisation has been taken over by some Climate Alarmists from the Isle of Man, Jersey or Scotland. Perhaps the Council is no longer fit for purpose.

    Update

    The actual meeting in London was full of the wind issue. See the Irish Times and BBC Wales.

Prof Nir Shaviv Presentation

A couple of blogs (Bishophill and Jo Nova) direct you to a short 30 minute presentation by Prof Vincent Courtillot. The proceeding presentation by Prof. Nir Shaviv on cosmic ray theory, though more technically advanced, is worth a look, especially if you compare the strength of his argument with the IPCC greenhouse theory.

For the non-scientist, the Shaviv thesis of solar changes explaining the 20th century warming episode is better than the IPCC greenhouse theory as

  • Has some corroborating evidence to suggest that cosmic rays are affecting the climate, with the extent.
  • Has a simple computer model that explains most of the twentieth century warming. In particular the two similar periods of warming from 1915 to 1940 and 1975 to 1998, and the pauses are all modelled quite well. Using Occams Razor  (the most succinct hypothesis, or that which needs the fewest assumptions), it beats the anthropogenic greenhouse gas theories. Alternatively, it is a better fit of the data, as AGW only fits the later warming. The early 20th century warming can only be explained by predominantly natural factors.
  • Is happy flicking between the decadal time-scale that he is trying to explain to geological time scale of hundreds of millions of years and then to the influence of solar flares that last a few days. Neither does he have problems with natural variations.

The IPCC greenhouse gas models do have a number of models that concur. But this can be explained that they have similar assumptions and assumptions behind them. Indeed, given the strong coherence it is a weakness that they have such a wide variation in the data. The IPCC

  • Lacks corroborating evidence, particularly of the tropical tropospheric hotspot.
  • Relies on computer models are highly complex, rely on a two-stage process (see note below), and have many ad hoc adjustments.
  • Yet these computer models that do not tie in very well with the data. To explain the lack of warming in the 1945 to 1978 period and post 1998 you have to resort to an ad hoc inclusion of aerosols. The early-twentieth century warming, so similar empirically, has to have a different explanations.
  • Greenhouse gas theory is uncomfortable with looking beyond the twentieth. It cannot explain the medieval warm period, hence the amount of backing for the infamous hockey stick which suggests the twentieth century warming was unusual. Neither can it explain the other natural fluctuations in the current inter-glacial.

An opposite view that Shaviv’s work is insignificant can be referenced at Sourcewatch, a highly pro-AGW site. They state

“While he does believe the earth is warming, he contends that the sun’s rays, rather than human produced CO2, are the cause. But a 2009 analysis of data “on the sun’s output in the last 25 years of the 20th century has firmly put the notion to rest. The data shows that even though the sun’s activity has been decreasing since 1985, global temperatures have continued to rise at an accelerating rate.”

There are counters to this is that Sourcewatch is speaking about the wrong thing. Shaviv contends it is cosmic rays emanating from elsewhere in the galaxy that affect cloud cover and by this means temperature. Solar winds (determined by solar activity) heavily influence the levels of cosmic rays reaching the earth. A much smaller influence is the solar variability. Shaviv shows the following slide (at 17 mins) to show the difference in his measured magnitudes.

Note on IPCC Climate models

The IPCC climate models do not just rely on greenhouse gases directly impacting on the temperature to generate global climate catastrophe. This was nicely summarized by Prof Richard Lindzen in his Congressional testimony of November 17th 2010. (Full pdf here, Warren Meyer comments here)

  1. A doubling of CO2, by itself, contributes only about 1C to greenhouse warming. All models project more warming, because, within models, there are positive feedbacks from water vapour and clouds, and these feedbacks are considered by the IPCC to be uncertain.
  2. If one assumes all warming over the past century is due to anthropogenic greenhouse forcing, then the derived sensitivity of the climate to a doubling of CO2 is less than 1C. The higher sensitivity of existing models is made consistent with observed warming by invoking unknown additional negative forcings from aerosols and solar variability as arbitrary adjustments.

Quote on Openness in Government

The Bovine Spongiform Encephalopathy (BSE) Inquiry, United Kingdom

“Our experience over this lengthy Inquiry has led us to the firm conclusion that a policy of openness is the correct approach. When responding to public or media demand for advice, the government must resist the temptation of attempting to appear to have all the answers in a situation of uncertainty. We believe that food scares and vaccine scares thrive on the belief that the Government is withholding information. If doubts are openly expressed and publicly explored, the public are capable of responding rationally and are more likely to accept reassurance and advice

if and when it comes.”

Quoted on page 40 of the WHO World Health Report 2002. (Here)

This seems to be also pertinent to the Climate Science in general and the UNIPCC in particular.

The BSE Inquiry Report details

http://www.cabdirect.org/abstracts/20002219667.html;jsessionid=42B120D8A52B9E491149695EB22E4EEB

Abstract

The inquiry was set up in 1997 to: establish and review the history and emergence and identification of BSE and variant CJD in the UK and of the action taken in response to it up to March 1996; to reach conclusions on the adequacy of that response; and to report the findings to relevant ministries. The resulting report documents in detail the development of two new diseases, one of cattle that devastated the British cattle industry (more than 170000 animals affected) and another that has caused the deaths of more than 80 people so far. The report identifies several shortcomings in delayed responses and lack of rigour in implementing measures. Poor coordination between health and agricultural departments and bureaucracy impeded prompt responses. The cause of the epidemic was identified as the inclusion of meat and bone meal in ruminant feed. Despite the banning of specified bovine offals in ruminant feed in 1990, cattle born after this date still contracted the disease, probably through cross contamination of feed with feed destined for non-ruminants. The report makes compelling reading for all those who have followed the epidemic. It is available from The Stationary Office (http://www.thestationeryoffice.com/bse/) in print (#325 for the complete boxed set of 16 volumes [ISBN 0105569860]; or #29.50 for Volume 1: Findings and Conclusions [contains a CD-ROM of the full text of the report; ISBN 0105569704]), on CD-ROM (#235 which includes the full text of the report on Disc 1. Discs 2-12 include all the witness statements, transcripts, SEAC and ACAF documents and other supporting documents; ISBN: 0105569879), or can be freely accessed on the Internet.

Climate Change in Perspective – Part 2 of 4 – The Mitigation Curve


The previous posting developed a simple graph showing the consensus case for climate change mitigation. This posting looks at the policy arguments, suggesting a huge gap between what is believed to be theoretically possible and what may be realistically achieved. The conclusion is stark. Mitigation policy optimization requires a political process that cannot deliver a result that will leave the world better for future generations.

The Mitigation Cost Curve

The previous posting presented in graphical form the consensus argument (UN IPCC & Stern) for stabilizing CO2 at around double the pre-industrial level, along with stabilizing other greenhouse gas emissions. That is that the costs of constraining the growth in levels of CO2 – are much less than the costs of allowing greenhouse gases temperature rises to go unchecked. Mitigation is essentially a cost minimization strategy with the Stern Review claims the benefits outweigh the costs 5 to 20 times. To put this into context, the Review states that the expected mean costs of mitigation will be annually 1% of annual global product (GWP). The costs of the actual climate change impact could be 5% of GDP or more.

The Prudent approach from this graph is to aim for point P. That is not the absolute minimum costs, but still much lower cost than the likely costs of doing nothing.

What is important to note is that the policy is not to reduce CO2 levels from the current levels of around 380ppm, but to stabilize the growth in emissions. This growth in emissions will come from the emerging economies, in particular from China where emissions per capita have recently been growing by 12% a year. The OECD countries have had largely static emissions per capita, and the population is very slow growing as well.

To turn theory into successful stabilization of CO2 at 550 to 600ppm, requires quite a extended process. I have attempted to break down this process into a flow chart showing the major steps. Next to each step is an arrow suggesting the direction the curve will move if the process is less than perfect.


The graph below shows the impact on the mitigation curve of a movement in the arrows.

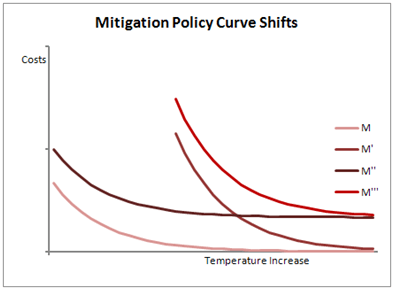
A movement to the right will shift the curve from M to M’. This is when the marginal costs increase. A movement upwards will shift the curve from M to M”. This is when costs are incurred that totally ineffective in influencing on CO2 levels. Finally there are policy shifts upwards and to the right, from M to M”’, which is a combination of higher marginal costs and ineffective elements.

Looking at the issues in turn.

Economic Theory

I will assume that the shape and position of the curve is correct. That is, there is a set of policies or actions in the real world that if applied will achieve the outcomes desired. However, these have to be discovered. Some low-cost constraints will be quite easy to discover. Others might be more difficult, relying on estimates from self-interested parties. The optimal policies will not be given for long periods, but could change over time with relative costs and technological advances. For instance, a technological breakthrough enabling much cheaper and compact batteries could transform the viability of electric cars. Therefore the switch from gasoline and diesel could be achieved with little or no subsidies.

A second assumption is that although the right economic policies will cost money, the optimal policies will have absolutely no impact on economic growth. This is a crucial assumption of the Stern Review. The policy costs will amount to around 1% of GDP at the end of the century, against costs of around 5% of GDP of climate change impacts if nothing is done. However, if growth rates are reduced by just 0.1% then in ninety years output will be over 9% lower. It is quite conceivable that a drastic change in climate policy would reduce China’s growth rate by 0.5%. By 2100 this would mean output was a full 35% lower than without the policy change. If growth by then has slowed to 3% per annum, living standards would lag 25 years, or a generation, behind where they would have been. Even if the 0.5% growth reduction is for just the first 40 years, output is still 17% lower. There may be a preference of trading a 9% lower living standards with certainty, to possible suffering from the harmful and random effects that will costAny policy that fails to recognize this

Equity

A simplistic analysis would take into account the actual costs. The cheapest ways to constrain growth in emissions is to impose a uniform policy globally. A country like Ethiopia, for instance, has nominal GDP per capita of less than 1% of the OECD average ($330 against $39473) according to World Bank Data. The real impact of a uniform carbon tax will be disproportionately felt by the poorest. The UNIPCC and Stern recognize this, but have not made an adequate provision allowance. The proposals are for the rich countries bear the overwhelming burden of the constraint in emissions and for monetary transfers to enable the poorest to grow economically without increasing their CO2 emissions. Stern recommends that the rich countries reduce their emissions by 80% per capita by 2050. However, this split will not be totally equitable. Within countries there are large inequalities in income and wealth. For instance, the richest 10% in Brazil have far better life styles than the poorest 10% in the United States. Any split between countries will leave many of the rich and powerful untouched by the policies, whilst leaving the poor in the OECD countries worse off.

Policy Identification

There are a number of possible tools to achieve a cost effective containment of CO2 growth. These include Cap and Trade; Carbon Taxes; encouraging technological development; carbon sequestration; building (or regulating the building of) new carbon-neutral power stations; and promoting energy saving through subsidies and regulation. Minimizing the costs and maximising the effectiveness of this containment requires optimizing these alternatives in terms of extent, combination and timeliness. As we do not know when to use each of these in terms of time and place, there needs to be learning through experience. When policies or initiatives are not producing results, there needs to be quick and decisive actions in constraining, changing or abandonment. Yet these decisive decisions need to be taken in the context of often only vaguely perceiving, even retrospectively, whether we are taking the best course of actions. Are we pursuing the right sort of alternative power supply? Is funding for our favoured form of future technology the correct one? If that technological preference is broadly the best are we favouring the best approach, or disregarding a far more efficient alternative? Are we applying Cap and Trade too far, or is the design of the policy inappropriate to achieve optimal result? Are any carbon taxes delivering reductions in CO2 with our cost constraints?

If we fail to optimize then policies like Cap and Trade will generate marginal costs much higher than planned. The curve shifts to the right. If the research for new low-cost carbon neutral energy consumption fails, then the curve shifts upward as we waste money. So overall, sub-optimal policy choice will shift the curve upwards and to the right.

International Negotiation

Climate change policies need to be spread broadly to be effective. If major countries are excluded, then the burden of constraint on the others will be that much greater. Yet mitigation policy is to inflict some costs now to avoid much greater costs in two, five or twenty generations down in the future. To get

  • Overstate the urgency and the extent of the problem.
  • Understate or fudge the immediate cost implications.
  • Alienate any who raise the slightest question about the efficacy of such agreements. There are plenty of NGOs to do this.
  • Understate the alternatives.
  • Provide a world stage for the leaders, including those would normally be ostracized. (Such as here and here).
  • Leave aside the implementation problems.


International Polices & Targets

The fudging is likely to affect the final policy. Nation states do not accept strict targets within cost constraint, with punishments meted out to those that fail. They will not relinquish part of their sovereignty and possibly their economic growth easily. But the poorer ones, with promises of cash to help them out, will be enthusiastic. Therefore any final agreement will load costs on those keenest on the policy, and plenty of loop-holes to allow those with other priorities, or those with a weak political grasp on power, to fudge. This does not have to be a permanent fudge

National Policies

There will be a number of different approaches. Cutting or CO2 levels or constraining the growth requires long-term policies, with short-term plaudits. In Britain’s case the implementation CO2 reduction target of 80% gained much praise in the international community. But the costs are mostly left to successor governments. The favoured form of green energy is easy to promote, but the rising energy costs and the prospect of future energy blackouts on windless and frost winter nights will be blamed on later governments.

In the short-term there may be some job benefits and subsidies. Promoting Cap and Trade will create jobs for those administering the scheme and large profits for those who can easily reduce their emissions and sell on the carbon credits. There are also jobs to be had in climate research and the development of new technologies.

There is also political benefit to be had from providing a reason to raise taxes. In Britain the green taxes have mostly been loaded onto the motorist. Yet such a policy is likely to have very little marginal impact on CO2 emissions for precisely them same reason that it is a very good way of raising extra tax revenue – demand is very inelastic with respect to price. It is only with viable and cost-effective substitutes (electric to replace the internal combustion engine) that we will see a switch.

The nature of deriving and maintaining political census will be to have little project management from the top down. Therefore, there will be initiatives that were sub-optimal to start with and less effective moving forward. There will be little focus on research, but plenty on public relations. Rather than maximizing effectiveness and minimizing costs, there will be other, self-justifying matrices developed. The biggest justification will be international obligations.

Policy Outcomes and Policy Feedbacks

There may be plenty of policy and much more rhetoric, but the policy outcomes are likely to be feeble at great cost. However, to obtain and maintain the optimal policies, there must be a feedback process. This feedback needs to influence every level, including the economic theory as shown below.

This needs to be a continual and dynamic process. For this to happen there needs to be objective and honest analysis of results to better refine and amend our view of the optimal policies at both national and international level. The size of the arrows indicates my personal assessment of the importance of each aspect. The biggest feedback is in the continuous altering of national policies, to bring into line with optimal policies. But there must be an ability to easily change course at all levels. This requires not just openness and flexibility, but surrender of policy in this area to an international body. But countries will not easily agree to shoulder more of the burden, or lose subsidies. They will not easily be told that they must change course. Vested interests in the environmental matters do not have a unique humility and objectivity that is absent in other groups. Neither will politicians easily admit that they have made errors of judgment, or that there are areas where they have neither the competency nor power to act upon.

Conclusion

The process of implementing an optimal policy, requires an openness and flexibility that does not exist. The whole policy process works against this. Politics is about negotiation and compromise between competing interests. It is about jostling for power, rewarding supporters and undermining the influence of opponents. It is also about other priorities as well, which in the short-term are more pressing. In the section on economic theory we I showed how a small reduction in economic growth can more than offset the worst consequences of the policy.

The problem now becomes two-fold.

  1. Guaranteeing how the revised optimal policy P”’ will be less costly than doing nothing and letting the total climate impact costs reach CCImax.
  2. Justifying to the developed nations why they should be significantly worse off than doing nothing.

In the next posting I will look at the validity of the estimation of the costs of climate change.


Climate Change Policy in Perspective – Part 1 of 4

Introduction

In the Climate Change policy there lacks a simple framework to assess the policy. There is a large consensus of scientists telling us that a large rise in global temperature will occur, and that the only policy in offer is to constrain the growth in greenhouse gas emissions globally. Presented below is a simple graphical model to encapsulate the central policy arguments of the UNIPCC and the 2006 Stern Review. That is, there are policies that can be implemented that though costly, will be an order of magnitude less than the disastrous consequences of letting global temperatures rise unchecked. These consequences will not only affect the human race and for the rest of the planet. Use of this model allows analysis of the relative importance of various issues in devising policy and implementing global policies needed to achieve the consensus objectives.

The starting point for the analysis is to assume that two propositions are correct. First, that if we do nothing in two centuries global average temperatures will be at 5-10oC warmer than at present. Second, that there exists in theory a set of policies that will comfortably constrain CO2 emissions to prevent the atmospheric CO2 levels going above 600ppm and thus preventing global temperatures rising more than 2oC above current levels. I also start from a moral basis for policy that few will disagree with. Political action should only be taken if there is a reasonable expectation that the resulting outcome be a better situation than if no action was taken at all. The treatment, if not a full cure, should at least be expected to leave the patient in a better condition than without treatment. This, I would claim, is an absolute minimum requirement for action, as it can still leave moral dilemmas. For instance, if the policies cause the deaths of a million people, but prevents a 10% chance of 11 million people dying, then it is justified on this rule.

There are four parts to this explanation, which I will divide into separate blog postings. Part one, below, develops a graph replicating the standard consensus argument of the overwhelming consensus case for action. Part two addresses the issues with policy, relating this through movements in the policy curve. Part three evaluates the impacts of that warming, showing how changing the analysis of risk and time can radically change our perception of the costs. Part four brings these together for an overall conclusion, with indications of areas for further research.

The basis of the model is that global warming will create costly consequences, both for the human race and for the rest of the planet. Proposals to resolve this we also be costly. It is therefore to economics that we must turn to understand the issue from the top-down.

Part One – The Consensus Argument for Mitigation in Graphical Form

The following aims to replicate the mainstream consensus case of catastrophic climate change and the mitigation policies deemed necessary to combat it.

The Costly Consequences of Global Warming

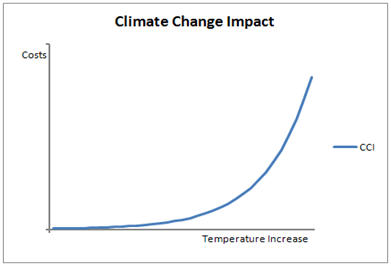
We are already seeing some of the minor consequences of increasing greenhouse gases through disrupted climate. But the scientists tell us this will be as nothing compared to what will happen if greenhouse gases continue to increase unchecked for the next century or more. The large increases in temperature – around 4oC to 7oC or higher – would cause massive disruption to the climate system. It is fair to say that as global temperatures increase, these costs would increase exponentially. These “costs” are in the broadest sense. They are not just the human costs of property damage, failed harvests, population migrations and land being submerged by rising seas. These include the damage to the eco-systems and species extinction. Graphically it would look something like this.

There is no scale on this graph. It cannot be predicted how far temperatures will increase if the growth in anthropogenic greenhouse gas emissions are not curtailed, nor at what point the catastrophic consequences will set in. What is essential to recognize is that allowing temperatures to increase will be many times worse than stabilizing that increase at lower temperatures. Without a check, it is near certain that the planet’s temperatures will climb to the top end of the graph with the level of costs predicted.

The Costs of Mitigation

The solution to the problem of climate change is to remove the cause of that change. To remove anthropogenic greenhouse gas emissions totally would be hugely costly. The economic wealth of the rich countries is based upon fossil fuel energy consumption. Stop the energy consumption and you not only stop economic growth, but potentially cause economic collapse. Instead, there must be a rapid but orderly switch in energy use to clean energy sources. This may actually spur economic output as the switch is made, but is more likely to be costly, but have at most a negligible but negative impact on economic growth. Similarly, in the emerging BRIC (Brazil, Russia, India & China) economies, satisfying their rapidly-rising energy demands from carbon-neutral sources need not constrain their economic growth. Indeed for China and India real living standard could rise more rapidly, as the cities suffer less from the choking effects of the pollution from burning fossil fuels. How will these costs map out? To stop climate change now and reverse the impacts would be hugely costly. Even to stabilize emissions at current levels globally would be hugely expensive. In particular with China and India increasing their emission levels rapidly, to stabilize globally would require huge cuts elsewhere. Far less costly would be to stabilize at some higher level than at present.

The shape of the cost of mitigation graph can be represented like this.

The costs of doing little are very small, whilst those of stopping global warming in its tracks, or even reversing the warming that has already occurred, are huge. We are able to choose the policy to pursue.

The Combined Costs of Climate Change and Mitigation

Climate change will incur costs of CCI. Combating climate change involves mitigation costs M. For any temperature that stabilization is reached, the total costs TC will be CCI+M.

The question as to which level of policy to pursue now becomes clearer. A highly aggressive policy could be just as damaging as doing nothing. However, we are left with a large middle ground. By stabilizing the temperature increase from pre-industrial levels at around 2-3oC is generally thought to be where this middle ground lies. However, as there is some uncertainty as to what average temperature the worst effects of climate change start to come into play, a prudent policy is to aim at stabilization at the lower end of the temperature range. Prudent policy is at around point P.

Climate Change in Perspective Part 2 – The Mitigation Curve

Bishop Hill and Comment Moderation

BishopHill has been having problems with comment moderation.

The comments are getting completely out of hand. Once again, please do not call people names. Stay on topic. I’m simply snipping whole comments now, because I do not have time to edit our people’s poor behaviour.


Perhaps if people would have more courtesy towards their opponents they would start to understand the opposing arguments. Then they may contrast it with their own and moderate their views.

Dogmatically assuming that your side is right and by implication that the opposition are either betrays our own fallibility. It is only by demonstrating an overwhelming and coherent case that one can legitimately use this in current debates without appearing out of touch with reality.

We must remember that the burden of presenting the case is on the side those who say we must act to prevent catastrophic global warming
climate change climate disruption. That just not just mean showing the case for the science is, on balance, correct. Simplified it means

First to demonstrate that CO2 and other greenhouse gases can cause a bit of warming, and how much
AND THEN
Show that this small temperature rise will lead to an increase in water vapour at high level to cause massive positive feedbacks (despite negative feedbacks being the norm in science)
AND THEN
Show that this warming will be of massive net harm to humanity and the planet (and that neither human society, nor the other creatures, nor plants will be able to adapt – despite much evidence to the contrary).
AND THEN
Show that mitigation policies – carbon taxes, cap n’ trade, subsidies to “clean” energy – will reduce greenhouse gases in THEORY, so long as all countries participate.
AND THEN
Show that when most of the emerging nations, particularly China and India, do nothing to curb emissions, that curbing emissions in theory will still work for the OECD countries.
AND THEN
Show that the governments pursuing the policies are capable of delivering the theoretical results. That is only taking on policies that meet the cost criteria laid down by the IPCC or Stern. Then project managing in fine detail and quickly ending failing projects.

As well as making the case for each of Forecast, Consequences, Policy theory and policy Implementation (FCPI), it must be combined together to show that, on balance, there is an expectation that the policy outcome will be better than if nothing was done. I believe that it is only on the basis of extreme and untenable assumptions in ALL of these four areas that the current policies can be justified.

My concern is that the “consensus” quickly grasps onto obscure bits of detail, or fine points of theory, or relies on prestige and opinion when challanged. Alternatively they question the motives of the critics.