Climate Change Impacts in AR5 – It is better than we thought

BishopHill has a screen shot of Climate change impacts for the new IPCC report. He notes the similarity to the AR4.

The differences are noticeable and demonstrate a subtle dilution of AR4.

First, the disappearing Himalayan Glaciers have disappeared – to be replaced by disappearing glaciers in Latin America.

Second, the potential disappearing Amazon forest has disappeared, to be replaced by tree species extinction.

Third, no mention of potential catastrophic losses of Antarctic sea ice or land ice. So that means that sea level rises are less of a problem.

Fourth, there is no mention of coastal storm damage. Roger Pielke Jnr has won the argument on hurricanes?

Fifth, species extinction is much more localised.

Sixth, global loss of wetlands reduced, to more seasonal coastal flooding in Asia. So that means that sea level rises are less of a problem.

Check out for yourselves.

2007 AR4

Which was developed from the Stern Review.

Climate Change Damage Impacts – A story embellished at every retelling

Willis Eschenbach has a posting on a recent paper on climate change damage impacts. This is my comment, with hyperlinks and tables.

My first reaction was “Oi– they have copied my idea!”

Well the damage function at least!

https://manicbeancounter.wordpress.com/2011/02/11/climate-change-policy-in-perspective-%E2%80%93-part-1-of-4/

Actually, this can be found by the claims of the Stern Review or AR4. Try looking at the table in AR4 of “Examples of impacts associated with global average temperature change” and you will get the idea.

A simpler, but more visual, perspective is gained from a slide produced for the launch of the Stern Review.

More seriously Willis, this is worse than you thought. The paper makes the claim that unlikely but high impact events should be considered. The argument is that the likelihood and impacts of potential catastrophes are both higher than previous thought. The paper then states

“Various tipping points can be envisaged (Lenton et al., 2008; Kriegler et al., 2009), which would lead to severe sudden damages. Furthermore, the consequent political or community responses could be even more serious.”

Both of these papers are available online at PNAS. The Lenton paper consisted of a group of academics specialising in catastrophic tipping points getting together for a retreat in Berlin. They concluded that these tipping points needed to include “political time horizons”, “ethical time horizons”, and where a “A significant number of people care about the fate of (a)

component”. That is, there is a host of non-scientific reasons for exaggerating the extent and the likelihood of potential events.

The Krieger paper says “We have elicited subjective probability intervals for the occurrence of such major changes under global warming from 43 scientists.” Is anybody willing to assess if the subjective probability intervals might deviate from objective probability intervals, and in which direction.

So the “Climate Change damage impacts” paper takes two embellished tipping points papers and adds “…the consequent political or community responses could be even more serious.”

There is something else you need to add into the probability equation. The paper assumes the central estimate of temperature rise from a doubling of CO2 levels is 2.8 degrees centigrade. This is only as a result of strong positive feedbacks. Many will have seen the recent discussions at Climateaudit and wattsupwiththat about the Spencer & Bracewell, Lindzen and Choi and Dessler papers. Even if Dessler is given the benefit of the doubt on this, the evidence for strong positive feedbacks is very weak indeed.

In conclusion, the most charitable view is that this paper takes an exaggerated view (both magnitude and likelihood) of a couple of papers with exaggerated views (both magnitude and likelihood), all subject to the occurrence of a temperature rise for which there is no robust empirical evidence.

Antarctic Ice Melt at the dogmatic “Skeptical Science”

Have just posted the following at BishopHill (who has being looking at review comments skepticalscience.com)

The comments are not the major issue with skepticalscience. It is the analysis. It picks from the peer-reviewed data to give the most alarmist spin, often ignoring the more rounded, more recent and less alarmist articles or data. (a pattern familiar to those who have read the Hockey Stick Illusion)

On Antarctic ice melt, this is certainly the case. SkS relies on a single author – Velicogna (two papers 2006 & 2009) – to substantiate the claim that the Antarctic pack ice is not just melting, it is accelerating. The 2009 paper looked at only six years of data. Yet less than two months ago there was published a paper that looked at a much longer period, looked at various studies (including Velicogna) and at different ways of estimating. It concluded that there may be some ice loss, but no acceleration. Anthony Watts summarises this paper quite nicely at http://wattsupwiththat.com/2011/07/27/antarctic-ice-%E2%80%93-more-accurate-estimates/

Watts’s article also links to the original article. Do not take the word of a (slightly) manic beancounter. Do the comparison and you will find that the SkS is anything but sceptical and far from scientific.

I would suggest that this is not an isolated incident either. I have found at least two more. Perhaps others could have a delve?

Would anyone like some suggestions where to start comparing SKs with other (more rounded) viewpoints?

  1. Why has it not warmed since 1998? SKS – It is because the oceans have been warming instead says Sks. But their data stops in 2003 – just when we started to get far more accurate data from some fancy buoys (search wattsupwiththat). It has stabilised since then. The air is not warming, neither are the oceans, so the alarmists have to go beyond the measurable.
  2. The economic case for carbon pricing has been made. If you take economic models as being reality, ignore the contrary arguments and most importantly ignore the public policy problems. I explain in theoretical terms here. Alternatively read books by Roger Pielke Jnr (the Climate Fix), Nigel Lawson (An Appeal to Reason), or Tim Worstall (Chasing Rainbows) for a better understanding of why policies will necessarily fail.

Will add others when I come across them.


Feedbacks in Climate Science and Keynesian Economics

Warren Meyer posts of a parallel between Climate Science and Keynesian Economics. I posted about a subject close to his heart, and central to Keynesianism – Feedbacks. I have also attempted to update on the current debate on feedbacks.

Warren

There is a parallel between Keynes and the CAGW that is close to your heart – feedbacks. Pure Keynesianism is that an increase in government expenditure at less than full employment would have a positive feedback response. Keynes called the feedback measure the multiplier. (The multiplier is the reciprocal of the proportion of Government expenditure to GDP. So if government expenditure was 20% of GDP, then a $1bn fiscal boost would increase output by $5bn.)

By the 1950’s the leading sceptic was Milton Friedman who, in his 1962 book “Capitalism and Freedom”, estimated empirically that the multiplier was about 1 – that is it did not have any impact. Friedman was denounced as a denier and a dinosaur. (At the same time, mainstream economics adapted his verificationist methodology.) Indeed by the end of the 1960s it was generally agreed that the long-term feedback impact of government demand management was negative, as increased government expenditure crowded out the private sector, caused escalating inflation (as economic actors ceased to be fooled by the false signals 0f increased expenditure), slowed economic growth and generally undermined the very structures of the capitalist system. (see Friedman’s Nobel Prize lecture “Inflation and Unemployment“)

Keynesian thinking is that the capitalist economic system is inherently unstable. Stability is only achieved through the guiding hand of government. Keynes contrasted this with a caricature of neoclassical economics, with the macroeconomic system would rapidly come back into equilibrium. Similarly, the climate models assumption of chronic instability is contrasted by an extreme caricature of those who disagree with them. That is the “deniers” are saying that the climate is incredibly stable, with human beings having no influence. In both cases the consequence of this caricaturing is to automatically claim any extreme occurrence as vindification of their perspective.

The Positives of Global Warming in Context

David Friedman makes some good points about the positive aspects of global warming. I would like to put the positives of global warming into context and pointing the way to making the analysis of the consequences of global warming more rigorous.

The consequences of global warming may have positive and negative consequences. The severity of any consequence should be assessed according to three factors.

  1. Magnitude – how large it will be. This can be over a number of dimensions. So a predicted worsening of hurricanes, for instance, might be in frequency, power and area.
  2. Likelihood. The Probability of a forecast event it occurring.
  3. Randomness. It is predicted the weather systems will become destabilised, so the weather will become the norm.

When extreme events are postulated, the magnitude that is most often over-stated is time. So sea levels are imagined to rise by a foot a year, not a century at the current rate (3.2mm per year is the best estimate). The rate of change is crucial here. Incremental changes over generational times scale we will not notice globally, as economic conditions change much more rapidly than this. Also there are unstated assumptions about the likelihood of the events. From an economic point of view, the potential costs can be many times over-stated by a combination of magnitude and likelihood. There are two main reasons to believe this is the case – adaptation and way-markers.

Adaptation is people changing to changed circumstances. The reason that living standards are over 30 times greater and the world population is more than 10 times greater than 300 years ago is than the human race cannot just adapt to changing conditions – in wealthy countries extreme weather events and failed harvests are hardly a problem. Look back to the 1960s and 1970s, the mainstream forecasts were for increasing poverty and starvation. With the exceptions where governments are extremely bad (North Korea, Zimbabwe) or there has been extensive conflict (Zaire), this has not been the case. But many of the prophesies of doom assume no adaptation at all. So literally, farmers will grow the same crops they always have, and people will not think of moving as the sea immerses their houses.

Way-markers are the signals of climate change happening now. Many of the extreme short-term forecasts have been falsified, or shown to be based on pseudo-science. Sea levels have failed to rise by 25 metres anytime soon, the Arctic was not ice-free in the summer of 2008, nor will it be in 2013; the snows of Kilimanjaro are not primarily disappearing due to rising temperatures; and the Himalayan glaciers will not be gone by 2035. The Bangladesh landmass has increased; the Amazon rainforest is not about to reach a tipping point; and the Maldives will not disappear beneath the waves. With these clear near-term failures, it is reasonable to say that more long-term extrapolations will be unlikely and exaggerated in magnitude.

On the other side, whilst individuals and communities are incapable of adapting to changes, the assumption is that Governments can fix anything at minimal cost. So, subject to a global agreement, CO2 can be constrained (according to the UK Stern Review) at one fifth to one twentieth of the likely costs of doing nothing. No allowance is made that government projects tend to overrun on costs and underperform on benefits, nor that the this degree of underperformance tends to proportionately rise with lack of planning, vagueness of objections, complexity of organisations involved and scale.

Finally, for those with a grounding in economics, I have an unfinished project analysing the above issues graphically here and here.

A note on HADCRUT3 v GISSTEMP

Have just posted to WUWT the following on global temperature anomalies:-

Thanks Luboš for a well-thought out article, and nicely summarised by

“The “error of the measurement” of the warming trend is 3 times larger than the result!”

One of the implications of this wide variability, and the concentration of temperature measurements in a small proportion of the land mass (with very little from the oceans covering 70% of the globe) is that one must be very careful in the interpretation of the data. Even if the surface stations were totally representative and uniformly accurate (no UHI) and the raw data properly adjusted (Remember Darwin, Australia on this blog?), there are still normative judgements to be made to achieve a figure.

I have done some (much cruder) analysis comparing HADCRUT3 to GISSTEMP for the period 1880 to 2010, which helps illustrate these judgemental decisions.

1. The temperature series agree on the large fluctuations, with the exception of the post 1945 cooling – it happens 2 or 3 years later and more slowly in GISSTEMP.

2. One would expect greater agreement with recent data in more recent years. But since 1997 the difference in temperature anomalies has widened by nearly 0.3 celsius – GISSTEMP showing rapid warming and HADCRUT showing none.

3. If you take the absolute change in anomaly from month to month and average from 1880 to 2010, GISSTEMP is nearly double that of HADCRUT3 – 0.15 degrees v 0.08. The divergence in volatility reduced from 1880 to the middle of last century, when GISSTEMP was around 40% more volatile than HADCRUT3. But since then the relative volatility has increased. The figures for the last five years are respectively about 0.12 and 0.05 degrees. That is GISSTEMP is around 120% more volatile that HADCRUT3.

This all indicates that there must be greater clarity in the figures. We need the temperature indices to be compiled by qualified independent statisticians, not by those who major in another subject. This is particularly true of the major measure of global warming, where there is more than a modicum of partisan elements.

These graphs help illustrate the points made. Please note that I use overlapping moving averages, so it is for illustrative purposes only.

NB. Luboš Motl’s article was cross-posted from his blog here

More than just shreds of evidence

BishopHill quotes approvingly from a comment made on the Booker column in yesterday’s Sunday Telegraph

I have worked in government for 28 years as an economist, and for the last 20 years I have worked on environmental programs. In that time I have not seen a shred of evidence to justify global warming, let alone man made global warming and I have not seen a shred of evidence that there is going to be a green economic boom. The only evidence I have seen is that there is a green economic bust, that money invested in green technologies is usually wasted and simply consumes investment that could be better used elsewhere. I think that anybody in government or industry who can not understand this is either dishonest, stupid, or both. That applies to Cameron – I think he is both.

For those who support the sentiments expressed should consider trying to convince someone who is a true believer in climate change consensus of their error. If the consensus supporter finds shreds of evidence of global warming, and hints that the warming may be due to anthropogenic factors, then they have refuted this experienced economist. Just as a sceptic who finds fault with the temperature record, or who has read about “hiding the decline” concludes that climate change is all a hoax, or a global conspiracy.

An economist should look at the costs and benefits. In terms of Climate Change there are two sets of costs. First, those of climate change impacts and second, the costs of the policy to contain the global warming. The Stern Review put argument that the mitigation policy costs were 5 to 20 times less than letting climate change progress unchecked. Therefore there is a clear-cut case for global mitigation policy. But crucially Stern does not look at the consequences of ineffective and over-expensive policy. The Booker article “For every new ‘green’ job, nearly four are lost” looks at one aspect of these real policy costs. An economist would also claim that the Greens fail to look at the opportunity costs, claim that the new jobs are a benefit.

I have tried to demonstrate this economic argument for climate change mitigation here. Then I examine why the policy proposed will be ineffective in constraining CO2 rises and the costs will escalate here. I hope to post soon on why the costs of climate change are hugely overstated.

The argument against the climate change policy is not that there is no evidence. Rather, it is that blundering and ineffective policy will be far more costly than five or six degrees of warming bringing on highly variable weather systems. That is an argument for the economists, not the climate scientists.

Name-Calling in Climate Change may harm Our Future

The Economist blog has a posting about the name calling from both sides of the Global Warming / Climate Change divide. Here is my comment, complete with links.

The name calling will lead to polarized views and more extreme policy. This is why.


There is no balance to all this name-calling. There is abundant evidence that anyone who doubts the Consensus, whether the science or the policy, is vilified. For sceptics, research grants are not nearly as available and sceptical views are more difficult to publish. Any public figure who doubts orthodoxy, or any business which funds scepticism, are targeted by pressure groups. Similarly, scientific groups who do not make strong position statements in favour are targeted by pressure groups and bloggers.

Even if the evidence is over-whelming in favour of there being significant anthropogenic climate change, consider the incentives for a scientist or policy-maker working in the field. The prerequisite for acceptance is singing-up to the main conclusion that mitigation policies are needed to combat likely and severe climate change. To pour doubt on that conclusion risks standing accused of being in the other camp. Novelty comes from restatement of this position in an original way, or from original, and more alarmist research.


It is in the area of policy this bias is most skewed. To check, the Economist should do a benefit-cost analysis, using as a starting point the Stern Review. Stern estimated the likely costs of climate change at 5 to 20 times the mitigation costs*. Then adjust for the more moderate view of climate change outlined in the Economist article in hyperlinked in the article, including a modicum of uncertainty. Then allow for some of the worst impacts (hurricanes, droughts, floods, etc.) are largely speculative. Then allow that some consequences, like sea level rise, will occur over generations. Therefore slow and low-cost adaptation is possible. Then allow for the benefits of temperature and CO2 rise in extending the margins and intensity of agriculture in many areas. Then allow that any politically feasible mitigation policy will be far less comprehensive (on a global scale) than Stern assumed. Then allow that policy choices will be constrained by political realities and that large ill-defined and complex government projects have a tendency to massively over-run on costs and underachieve on benefits – the Economist archive is a good place to verify this supposition.


Well before crunching the final numbers, there will an irreversible tipping-point reached on the benefit-cost analysis. Current mitigation policies will leave future generations worse off than if nothing were done at all. We reach the wrong policy conclusion by letting the issue become polarized.


*The Stern review has some ambiguous statements. The directgov site hyperlinked above says

If we take no action to control emissions, each tonne of CO2 that we emit now is causing damage worth at least $85 – but these costs are not included when investors and consumers make decisions about how to spend their money.  Emerging schemes that allow people to trade reductions in CO2 have demonstrated that there are many opportunities to cut emissions for less than $25 a tonne.   In other words, reducing emissions will make us better off.


But what is clear is that the costs of climate change have been overstated and an extremely naïve assumptions about the efficacy of policy is included.

Climate Change in Perspective – Part 2 of 4 – The Mitigation Curve


The previous posting developed a simple graph showing the consensus case for climate change mitigation. This posting looks at the policy arguments, suggesting a huge gap between what is believed to be theoretically possible and what may be realistically achieved. The conclusion is stark. Mitigation policy optimization requires a political process that cannot deliver a result that will leave the world better for future generations.

The Mitigation Cost Curve

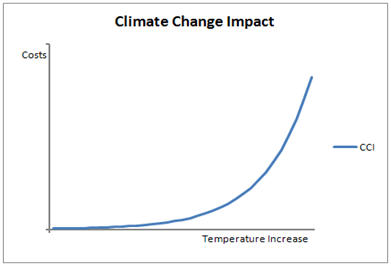
The previous posting presented in graphical form the consensus argument (UN IPCC & Stern) for stabilizing CO2 at around double the pre-industrial level, along with stabilizing other greenhouse gas emissions. That is that the costs of constraining the growth in levels of CO2 – are much less than the costs of allowing greenhouse gases temperature rises to go unchecked. Mitigation is essentially a cost minimization strategy with the Stern Review claims the benefits outweigh the costs 5 to 20 times. To put this into context, the Review states that the expected mean costs of mitigation will be annually 1% of annual global product (GWP). The costs of the actual climate change impact could be 5% of GDP or more.

The Prudent approach from this graph is to aim for point P. That is not the absolute minimum costs, but still much lower cost than the likely costs of doing nothing.

What is important to note is that the policy is not to reduce CO2 levels from the current levels of around 380ppm, but to stabilize the growth in emissions. This growth in emissions will come from the emerging economies, in particular from China where emissions per capita have recently been growing by 12% a year. The OECD countries have had largely static emissions per capita, and the population is very slow growing as well.

To turn theory into successful stabilization of CO2 at 550 to 600ppm, requires quite a extended process. I have attempted to break down this process into a flow chart showing the major steps. Next to each step is an arrow suggesting the direction the curve will move if the process is less than perfect.


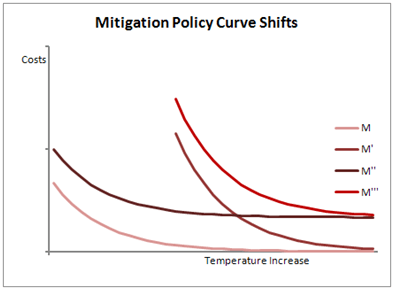
The graph below shows the impact on the mitigation curve of a movement in the arrows.

A movement to the right will shift the curve from M to M’. This is when the marginal costs increase. A movement upwards will shift the curve from M to M”. This is when costs are incurred that totally ineffective in influencing on CO2 levels. Finally there are policy shifts upwards and to the right, from M to M”’, which is a combination of higher marginal costs and ineffective elements.

Looking at the issues in turn.

Economic Theory

I will assume that the shape and position of the curve is correct. That is, there is a set of policies or actions in the real world that if applied will achieve the outcomes desired. However, these have to be discovered. Some low-cost constraints will be quite easy to discover. Others might be more difficult, relying on estimates from self-interested parties. The optimal policies will not be given for long periods, but could change over time with relative costs and technological advances. For instance, a technological breakthrough enabling much cheaper and compact batteries could transform the viability of electric cars. Therefore the switch from gasoline and diesel could be achieved with little or no subsidies.

A second assumption is that although the right economic policies will cost money, the optimal policies will have absolutely no impact on economic growth. This is a crucial assumption of the Stern Review. The policy costs will amount to around 1% of GDP at the end of the century, against costs of around 5% of GDP of climate change impacts if nothing is done. However, if growth rates are reduced by just 0.1% then in ninety years output will be over 9% lower. It is quite conceivable that a drastic change in climate policy would reduce China’s growth rate by 0.5%. By 2100 this would mean output was a full 35% lower than without the policy change. If growth by then has slowed to 3% per annum, living standards would lag 25 years, or a generation, behind where they would have been. Even if the 0.5% growth reduction is for just the first 40 years, output is still 17% lower. There may be a preference of trading a 9% lower living standards with certainty, to possible suffering from the harmful and random effects that will costAny policy that fails to recognize this

Equity

A simplistic analysis would take into account the actual costs. The cheapest ways to constrain growth in emissions is to impose a uniform policy globally. A country like Ethiopia, for instance, has nominal GDP per capita of less than 1% of the OECD average ($330 against $39473) according to World Bank Data. The real impact of a uniform carbon tax will be disproportionately felt by the poorest. The UNIPCC and Stern recognize this, but have not made an adequate provision allowance. The proposals are for the rich countries bear the overwhelming burden of the constraint in emissions and for monetary transfers to enable the poorest to grow economically without increasing their CO2 emissions. Stern recommends that the rich countries reduce their emissions by 80% per capita by 2050. However, this split will not be totally equitable. Within countries there are large inequalities in income and wealth. For instance, the richest 10% in Brazil have far better life styles than the poorest 10% in the United States. Any split between countries will leave many of the rich and powerful untouched by the policies, whilst leaving the poor in the OECD countries worse off.

Policy Identification

There are a number of possible tools to achieve a cost effective containment of CO2 growth. These include Cap and Trade; Carbon Taxes; encouraging technological development; carbon sequestration; building (or regulating the building of) new carbon-neutral power stations; and promoting energy saving through subsidies and regulation. Minimizing the costs and maximising the effectiveness of this containment requires optimizing these alternatives in terms of extent, combination and timeliness. As we do not know when to use each of these in terms of time and place, there needs to be learning through experience. When policies or initiatives are not producing results, there needs to be quick and decisive actions in constraining, changing or abandonment. Yet these decisive decisions need to be taken in the context of often only vaguely perceiving, even retrospectively, whether we are taking the best course of actions. Are we pursuing the right sort of alternative power supply? Is funding for our favoured form of future technology the correct one? If that technological preference is broadly the best are we favouring the best approach, or disregarding a far more efficient alternative? Are we applying Cap and Trade too far, or is the design of the policy inappropriate to achieve optimal result? Are any carbon taxes delivering reductions in CO2 with our cost constraints?

If we fail to optimize then policies like Cap and Trade will generate marginal costs much higher than planned. The curve shifts to the right. If the research for new low-cost carbon neutral energy consumption fails, then the curve shifts upward as we waste money. So overall, sub-optimal policy choice will shift the curve upwards and to the right.

International Negotiation

Climate change policies need to be spread broadly to be effective. If major countries are excluded, then the burden of constraint on the others will be that much greater. Yet mitigation policy is to inflict some costs now to avoid much greater costs in two, five or twenty generations down in the future. To get

  • Overstate the urgency and the extent of the problem.
  • Understate or fudge the immediate cost implications.
  • Alienate any who raise the slightest question about the efficacy of such agreements. There are plenty of NGOs to do this.
  • Understate the alternatives.
  • Provide a world stage for the leaders, including those would normally be ostracized. (Such as here and here).
  • Leave aside the implementation problems.


International Polices & Targets

The fudging is likely to affect the final policy. Nation states do not accept strict targets within cost constraint, with punishments meted out to those that fail. They will not relinquish part of their sovereignty and possibly their economic growth easily. But the poorer ones, with promises of cash to help them out, will be enthusiastic. Therefore any final agreement will load costs on those keenest on the policy, and plenty of loop-holes to allow those with other priorities, or those with a weak political grasp on power, to fudge. This does not have to be a permanent fudge

National Policies

There will be a number of different approaches. Cutting or CO2 levels or constraining the growth requires long-term policies, with short-term plaudits. In Britain’s case the implementation CO2 reduction target of 80% gained much praise in the international community. But the costs are mostly left to successor governments. The favoured form of green energy is easy to promote, but the rising energy costs and the prospect of future energy blackouts on windless and frost winter nights will be blamed on later governments.

In the short-term there may be some job benefits and subsidies. Promoting Cap and Trade will create jobs for those administering the scheme and large profits for those who can easily reduce their emissions and sell on the carbon credits. There are also jobs to be had in climate research and the development of new technologies.

There is also political benefit to be had from providing a reason to raise taxes. In Britain the green taxes have mostly been loaded onto the motorist. Yet such a policy is likely to have very little marginal impact on CO2 emissions for precisely them same reason that it is a very good way of raising extra tax revenue – demand is very inelastic with respect to price. It is only with viable and cost-effective substitutes (electric to replace the internal combustion engine) that we will see a switch.

The nature of deriving and maintaining political census will be to have little project management from the top down. Therefore, there will be initiatives that were sub-optimal to start with and less effective moving forward. There will be little focus on research, but plenty on public relations. Rather than maximizing effectiveness and minimizing costs, there will be other, self-justifying matrices developed. The biggest justification will be international obligations.

Policy Outcomes and Policy Feedbacks

There may be plenty of policy and much more rhetoric, but the policy outcomes are likely to be feeble at great cost. However, to obtain and maintain the optimal policies, there must be a feedback process. This feedback needs to influence every level, including the economic theory as shown below.

This needs to be a continual and dynamic process. For this to happen there needs to be objective and honest analysis of results to better refine and amend our view of the optimal policies at both national and international level. The size of the arrows indicates my personal assessment of the importance of each aspect. The biggest feedback is in the continuous altering of national policies, to bring into line with optimal policies. But there must be an ability to easily change course at all levels. This requires not just openness and flexibility, but surrender of policy in this area to an international body. But countries will not easily agree to shoulder more of the burden, or lose subsidies. They will not easily be told that they must change course. Vested interests in the environmental matters do not have a unique humility and objectivity that is absent in other groups. Neither will politicians easily admit that they have made errors of judgment, or that there are areas where they have neither the competency nor power to act upon.

Conclusion

The process of implementing an optimal policy, requires an openness and flexibility that does not exist. The whole policy process works against this. Politics is about negotiation and compromise between competing interests. It is about jostling for power, rewarding supporters and undermining the influence of opponents. It is also about other priorities as well, which in the short-term are more pressing. In the section on economic theory we I showed how a small reduction in economic growth can more than offset the worst consequences of the policy.

The problem now becomes two-fold.

  1. Guaranteeing how the revised optimal policy P”’ will be less costly than doing nothing and letting the total climate impact costs reach CCImax.
  2. Justifying to the developed nations why they should be significantly worse off than doing nothing.

In the next posting I will look at the validity of the estimation of the costs of climate change.


Climate Change Policy in Perspective – Part 1 of 4

Introduction

In the Climate Change policy there lacks a simple framework to assess the policy. There is a large consensus of scientists telling us that a large rise in global temperature will occur, and that the only policy in offer is to constrain the growth in greenhouse gas emissions globally. Presented below is a simple graphical model to encapsulate the central policy arguments of the UNIPCC and the 2006 Stern Review. That is, there are policies that can be implemented that though costly, will be an order of magnitude less than the disastrous consequences of letting global temperatures rise unchecked. These consequences will not only affect the human race and for the rest of the planet. Use of this model allows analysis of the relative importance of various issues in devising policy and implementing global policies needed to achieve the consensus objectives.

The starting point for the analysis is to assume that two propositions are correct. First, that if we do nothing in two centuries global average temperatures will be at 5-10oC warmer than at present. Second, that there exists in theory a set of policies that will comfortably constrain CO2 emissions to prevent the atmospheric CO2 levels going above 600ppm and thus preventing global temperatures rising more than 2oC above current levels. I also start from a moral basis for policy that few will disagree with. Political action should only be taken if there is a reasonable expectation that the resulting outcome be a better situation than if no action was taken at all. The treatment, if not a full cure, should at least be expected to leave the patient in a better condition than without treatment. This, I would claim, is an absolute minimum requirement for action, as it can still leave moral dilemmas. For instance, if the policies cause the deaths of a million people, but prevents a 10% chance of 11 million people dying, then it is justified on this rule.

There are four parts to this explanation, which I will divide into separate blog postings. Part one, below, develops a graph replicating the standard consensus argument of the overwhelming consensus case for action. Part two addresses the issues with policy, relating this through movements in the policy curve. Part three evaluates the impacts of that warming, showing how changing the analysis of risk and time can radically change our perception of the costs. Part four brings these together for an overall conclusion, with indications of areas for further research.

The basis of the model is that global warming will create costly consequences, both for the human race and for the rest of the planet. Proposals to resolve this we also be costly. It is therefore to economics that we must turn to understand the issue from the top-down.

Part One – The Consensus Argument for Mitigation in Graphical Form

The following aims to replicate the mainstream consensus case of catastrophic climate change and the mitigation policies deemed necessary to combat it.

The Costly Consequences of Global Warming

We are already seeing some of the minor consequences of increasing greenhouse gases through disrupted climate. But the scientists tell us this will be as nothing compared to what will happen if greenhouse gases continue to increase unchecked for the next century or more. The large increases in temperature – around 4oC to 7oC or higher – would cause massive disruption to the climate system. It is fair to say that as global temperatures increase, these costs would increase exponentially. These “costs” are in the broadest sense. They are not just the human costs of property damage, failed harvests, population migrations and land being submerged by rising seas. These include the damage to the eco-systems and species extinction. Graphically it would look something like this.

There is no scale on this graph. It cannot be predicted how far temperatures will increase if the growth in anthropogenic greenhouse gas emissions are not curtailed, nor at what point the catastrophic consequences will set in. What is essential to recognize is that allowing temperatures to increase will be many times worse than stabilizing that increase at lower temperatures. Without a check, it is near certain that the planet’s temperatures will climb to the top end of the graph with the level of costs predicted.

The Costs of Mitigation

The solution to the problem of climate change is to remove the cause of that change. To remove anthropogenic greenhouse gas emissions totally would be hugely costly. The economic wealth of the rich countries is based upon fossil fuel energy consumption. Stop the energy consumption and you not only stop economic growth, but potentially cause economic collapse. Instead, there must be a rapid but orderly switch in energy use to clean energy sources. This may actually spur economic output as the switch is made, but is more likely to be costly, but have at most a negligible but negative impact on economic growth. Similarly, in the emerging BRIC (Brazil, Russia, India & China) economies, satisfying their rapidly-rising energy demands from carbon-neutral sources need not constrain their economic growth. Indeed for China and India real living standard could rise more rapidly, as the cities suffer less from the choking effects of the pollution from burning fossil fuels. How will these costs map out? To stop climate change now and reverse the impacts would be hugely costly. Even to stabilize emissions at current levels globally would be hugely expensive. In particular with China and India increasing their emission levels rapidly, to stabilize globally would require huge cuts elsewhere. Far less costly would be to stabilize at some higher level than at present.

The shape of the cost of mitigation graph can be represented like this.

The costs of doing little are very small, whilst those of stopping global warming in its tracks, or even reversing the warming that has already occurred, are huge. We are able to choose the policy to pursue.

The Combined Costs of Climate Change and Mitigation

Climate change will incur costs of CCI. Combating climate change involves mitigation costs M. For any temperature that stabilization is reached, the total costs TC will be CCI+M.

The question as to which level of policy to pursue now becomes clearer. A highly aggressive policy could be just as damaging as doing nothing. However, we are left with a large middle ground. By stabilizing the temperature increase from pre-industrial levels at around 2-3oC is generally thought to be where this middle ground lies. However, as there is some uncertainty as to what average temperature the worst effects of climate change start to come into play, a prudent policy is to aim at stabilization at the lower end of the temperature range. Prudent policy is at around point P.

Climate Change in Perspective Part 2 – The Mitigation Curve