Velicogna 2009 and Chen et al 2009 on Acceleration in Antarctic Ice Melt

This blog post started out as some musings on the different way of measuring the changes in the mass of Antarctic land ice, as a follow up to a couple of comments to Jo Nova’s posting “Antarctica gaining Ice Mass — and is not extraordinary compared to 800 years of data.” The problem with this is that it looks at just part of the total ice mass balance. These lead me to look at the major papers that looked to Total Mass Balance. There are two from 2009, using early data from the GRACE satellite gravity mission Velicogna and Chen et al. In comparing the various estimates, I discovered three anomalies that should have been detected as part of the peer review process.

Error in Velicogna Summary

The abstract notes

In Greenland, the mass loss increased from 137 Gt/yr in 2002–2003 to 286 Gt/yr in 2007–2009, i.e., an acceleration of −30 ± 11 Gt/yr2 in 2002–2009. In Antarctica the mass loss increased from 104 Gt/yr in 2002–2006 to 246 Gt/yr in 2006–2009, i.e., an acceleration of −26 ± 14 Gt/yr2 in 2002–2009.

When I tried to replicate this for Greenland, the figures worked out. Starting with 122 Gt/yr a year ice loss in 1992 and adding 30 to each year gives the “137 Gt/yr in 2002–2003 to 286 Gt/yr in 2007–2009“. But for Antarctica, adding 26 to each year cannot give “the mass loss increased from 104 Gt/yr in 2002–2006 to 246 Gt/yr in 2006–2009“. However, if the statement is rephrased with the Greenland timescales as “the mass loss increased from 104 Gt/yr in 2002–2003 to 246 Gt/yr in 2007–2009” then the numbers work out.


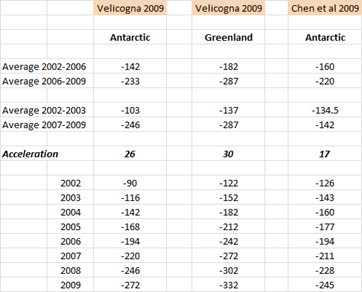
The spread sheet is easy to construct. For Velicogna Antarctica, start with -90 in 2002 and subtract 26 from the preceding year. The average uses the “=AVERAGE()” function in Excel.

So why did this dating error occur? There is no apparent reason in the Velicogna paper to use two different averages over such a short time frame. I might suggest that there is another reason. The two papers were published weeks apart (Velicogna 13th Oct and Chen 22nd Nov) and used the same data for Antarctica over similar periods (Velicogna Apr 02 – Feb 09 and Chen Apr 02 – Jan 09). The impact of both would be enhanced if they had comparative statistics. For instance Zwally & Giovinetto 2011 state

Table 2 includes two GRACE-based mass loss estimates of 104 Gt/year (Velicogna 2009) and 144 Gt/year (Chen et al. 2009) for the period 2002–2006 and two estimates of 246 Gt/year (Velicogna 2009) and of 220 Gt/year (Chen et al. 2009) for the period 2006–2009.

Correcting Velicogna, it becomes

Table 2 includes two GRACE-based mass loss estimates of 142 Gt/year (Velicogna 2009) and 144 Gt/year (Chen et al. 2009) for the period 2002–2006 and two estimates of 233 Gt/year (Velicogna 2009) and of 220 Gt/year (Chen et al. 2009) for the period 2006–2009.

That is, the two papers become far more consistent if the averages are corrected. It would appear that Velicogna changed the dates without doing the maths.

Form of the acceleration

Velicogna states in the abstract

We find that during this time period the mass loss of the ice sheets is not a constant, but accelerating with time, i.e., that the GRACE observations are better represented by a quadratic trend than by a linear one, implying that the ice sheets contribution to sea level becomes larger with time.

This quadratic trend is backed up by graphs on the NASA website (Antarctica) and NOAA websites (Greenland)


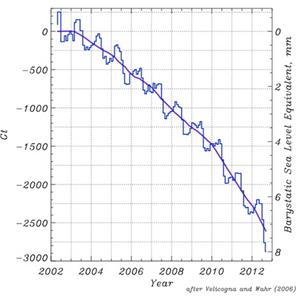
For ice melt Velicogna is stating that, not only would the trend be for each year to be greater than the previous year, but for the incremental increase to be greater than the last.

But, if ∂M is the change in ice mass, from the following functions were used in my spread sheet to replicate both Velicogna’s and Chen’s results.

For Velicogna 2009, Antarctica

∂M = -90 – 26(Year-2002)

For Velicogna 2009, Greenland

∂M = -122 + 30(Year-2002)

For Chen et al. 2009, Antarctica

∂M = -126 + 17(Year-2002)

These are all linear functions. I do not have access to Chen’s paper, but Velicogna’s abstract does not conform to her model.

Discontinuous functions in Chen et al. 2009

The abstract for Chen states

… our data suggest that East Antarctica is losing mass, mostly in coastal regions, at a rate of −57±52 Gt yr−1, apparently caused by increased ice loss since the year 2006.

Chen detection of increased ice loss is similar to Velicogna’s. But unlike Velicogna, Chen suggests that there is a discontinuous function. In other words, Chen’s graph would look like this.


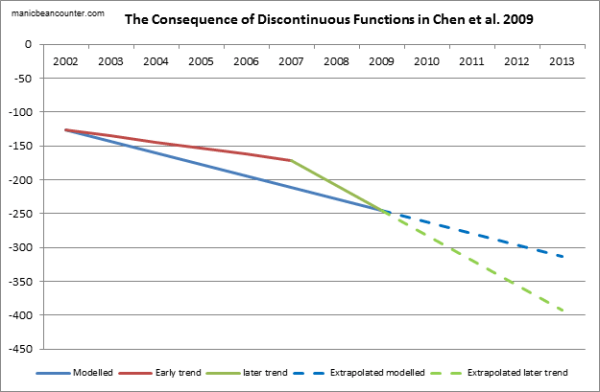
Although it is possible to extrapolate from a discontinuous function, it would be highly misleading to do so. It suggests there is no underlying empirical relationship to be observed, in direct contradiction to Velicogna. Further, over a short period it is impossible to say whether this is the shift in the underlying rate of change in Antarctic melt, or if this new direction be quickly reversed. Fortunately, the two studies were published over three years ago, so there are alternative studies to compare the projection against. This will be the topic of the next post.

J. L. Chen, C. R. Wilson, D. Blankenship & B. D. Tapley Nature Geoscience 2, 859 – 862 (2009) Published online: 22 November 2009 doi:10.1038/ngeo694

Velicogna, I. (2009), Increasing rates of ice mass loss from the Greenland and Antarctic ice sheets revealed by GRACE, Geophys. Res. Lett., 36, L19503, doi:10.1029/2009GL040222

H. Jay Zwally, Mario B. Giovinetto (2011) Surveys in Geophysics September 2011, Volume 32, Issue 4-5, pp 351-376, Overview and Assessment of Antarctic Ice-Sheet Mass Balance Estimates: 1992–2009 10.1007/s10712-011-9123-5

Dehumanizing Climate Sceptics

Steve Mcintyre did some research on Dr Paul Bain – the same who Jo Nova had a long correspondence with a few months ago.

Dehumanizing Language
A few months ago, in an article in Nature Climate Change, Paul Bain, another Australian psychologist, repeatedly used the term “denier” to refer to climate skeptics. Bain defended this usage at Judy Curry’s on the basis that it would “activate the strongest confirming stereotypes” in his target audience:
By using the term “denier” we wanted to start with something that would activate the strongest confirming stereotypes in this audience
Bain’s usage was sharply criticized by skeptic blogs (though it was not an issue that I bothered with.) Judy Curry made the following interesting suggestion:

Somebody needs to research the sociology and psychology of people that insist that anyone that does not accept AGW as a rationale for massive CO2 mitigation efforts is a “denier.”

Judy’s invitation unfortunately was not followed up in the comments. Had this been done, people would have made the surprising discovery that, in his “day job”, Bain primarily wrote about the use and function of derogatory epithets (e.g. cockroach in the Hutu-Tutsi and other racially charged terms). Bain observed that a primary function of dehumanizing language is to reinforce the self-esteem of the “in group”:
For example, Bain observed

Subtle forms of dehumanization are often explained with reference to …the idea that the in group is attributed “the human essence” more than outgroups, and hence outgroups are implicitly seen as “non-human”. ..

People typically evaluate their in-groups more favorably than out-groups and themselves more favorably than others…

such labeling has the effect of denying full humanness to the out group, reinforcing the self-esteem of the in-group..

The denial of full humanness to others, and the cruelty and suffering that accompany it, is an all-too familiar phenomenon…

Despite Bain’s prolific writing on the use and abuse of dehumanizing epithets, he was oddly oblivious to the function of the term “denier” as a means of dehumanizing IPCC critics.

My interpretation of Bains’ scientific research is that likening sceptics to Nazis or pedophiles shows the collective insecurities and feelings of inadequacy of those making the comments. Deep down they know that their beliefs are built on sand, and are desperately finding ways not to acknowledge this. Dehumanizing those who challenge their beliefs is nothing new. It is an easy position to fall into, and takes courage to challenge.

Lewandowsky’s Recursive Corruption of Science

Wattsupwiththat have a guest post by Brandon Shollenberger on “Stephan Lewandowsky and John Cook – making things up“. It details how the Recursive Fury paper elements that are fabricated. This is a comment just posted.

The “Recursive fury” paper fails to consider an alternative hypothesis. If psychology expert L came along and said that you should not be listened to about subject A, which you believe strongly about, because:-

(a) Nearly all the “experts” disagree with you.

(b) Some fellow believers allegedly have political beliefs that the person L does not like.

(c) A higher proportion of your fellow believers than L’s group allegedly hold other beliefs that most people view as being “nutty

Then you would be somewhat upset – a normal, human, reaction. If you later found out that the claims about the experts were not true, the questions were biased and the statistical conclusions were contradicted by basic statistical analysis, you would be justifiably furious.

Like with people who attribute every extreme weather event to global warming, Lewandowsky bases his case for ignoring sceptical opinions on a distorted opinion of corrupted evidence. When it gets a very predictable response, he interprets this with a distorted opinion of corrupted evidence. The only recursive bit is in the methods Lewandowsky employs in corrupting science.

Lewandowsky et al. 2012 (LOG12) – Questionnaire examined

The latest paper from Lewandowsky is

Conspiracist ideation in the blogosphere in response to research on conspiracist ideation : Stephan Lewandowsky, John Cook1,, Klaus Oberauer and Michael Hubble

The authors explain

This article analyzes the response of the climate blogosphere to the publication of LOG12. We identify and trace the hypotheses that emerged in response to LOG12 and that questioned the validity of the paper’s conclusions. Using established criteria to identify conspiracist ideation, we show that many of the hypotheses exhibited conspiratorial content and counterfactual thinking.

In order to respond, it is first necessary to gain a proper understanding of the original questionnaire and the conclusions the authors reached. This posting starts with examining the forty questions to see if the questions were balanced or designed to support the authors’ hypotheses. The full list can be found at Joanne Nova’s website.

Free-market Politics Questions

1. An economic system based on free markets unrestrained by government interference automatically works best to meet human needs.
2. I support the free-market system but not at the expense of environmental quality
3. The free-market system may be efficient for resource allocation, but it is limited in its capacity to promote social justice
4. The preservation of the free market system is more important than localized environmental concerns
5. Free and unregulated markets pose important threats to sustainable development
6. The free-market system is likely to promote unsustainable consumption

There were two areas that the questionnaire tried to test around the motivated rejection of climate science – free-market ideology and conspiracist ideation. The first six questions dealt with belief in free markets. There are a number of issues.

First, those who believe in free-markets are libertarians. They value individual liberty above all else and see laissez-faire capitalism as the only means to achieve this. The reason for many rejecting climate change policies is a belief that it would lead to a suppression of individual choice. They can also see that those who oppose the “scientific” consensus are stigmatized, and criticism suppressed. They might see historical parallels in the rise of communism, Nazism and in the McCarthyist era. Without such questions, rejection of the consensus could be viewed as much shallower and more dogmatic than is actually the case.

Second is that these questions are framed by somebody who clearly does not understand nor like the market mechanism. Most free-marketers would not view it a structural system, but a spontaneous order. Nor would they see a market mechanism as being antagonistic to development or preserving the environment.

Third is that there are a large group of people who may general reject environmentalism, but be quite centrist in their political views. Conversely, there might be some people who are highly antagonist to capitalism, but also sceptical of global warming. Without questions for a broad range of political views, responses will be more polarized than is actually the case.

In conclusion, these six questions seem aimed at marginalizing sceptics.

Conspiracy Theory Questions

A total of 15 questions

7. The Iraq War in 2003 was launched for reasons other than to remove WMD from Iraq
8. A powerful and secretive group known as the New World Order are planning to eventually rule the world through an autonomous world government, which would replace sovereign governments
9. SARS was produced under laboratory conditions as a biological weapon
10. The US government had foreknowledge about the Japanese attack on Pearl Harbor, but allowed the attack to take place to as to be able to enter the Second World War.
11. US Agencies intentionally created the AIDS epidemic and administered it to Black and gay men in the 1970’s
12. The assassination of Martin Luther King Jr was the results of an organized conspiracy by US government agencies such as the CIA and FBI
13. The Apollo Moon landings never happened and were stages in a Hollywood film studio
14. Area 51 in Nevada US is a secretive military base that contains hidden alien spacecraft and or alien bodies
15. The assassination of John F Kennedy was not committed by the lone gunman, Lee Harvey Oswald, but was rather a detailed, organized conspiracy to kill the President
16. The US government allowed the 9/11 attacks to take place so that it would have an excuse to achieve foreign (eh wars in Afghanistan and Iraq) and domestic (eg attacks on civil liberties) goals that had been determined prior to the attacks
17. In July 1947, the US military recovered the wreckage of an alien craft from Roswell, New Mexico and covered up the fact
18. Princess Diana’s death was not an accident but rather an organised assassination by members of the British royal family who disliked her
19. The Oklahoma City Bombers, Timothy McVeigh and Terry Nicols did not act alone but rather received assistance from Neo Nazi groups
20. The claim that the climate is changing due to emissions from fossil fuels is a hoax perpetrated by corrupt scientists who wish to spend more taxpayer money on climate “research”.
21. The Coca Cola company intentionally changed to an inferior formular with the intent of driving up demand for their classic product, later reintroducing it for their financial gain.

When I first looked at these questions it struck me that some were related to the climate issue. Therefore I left them out as biasing the results.

I think there are five broad categories of question, which I have colour-coded.

Blue questions are neutral to the climate change issue.

Red questions are those that see the climate consensus as some sort of conspiracy.

Green questions are those that see motivations for rejecting the climate consensus as some sort of conspiracy.

Pink Questions are conspiracies that those who reject the climate consensus might believe in, but unrelated to the climate issue.

Brown Questions are conspiracies that those who accept the climate consensus might believe in, but unrelated to the climate issue.

What is clear is that there are no questions that ask if scepticism was underpinned by of some sort of conspiracy. A common theme is that denial being promoted by secretive funding by fossil fuel interests. For instance searching “Koch” on Desmogblog reveals 2440 hits. With such a question, there would have been symmetry. I have rated question 7 (WMD) as possibly appealing more to the climate consensus types, as they tend to be more to the left of centre and certainly are mostly anti George Bush. This was the only question NOT reported in the LOG12 paper. So two conspiracy-type questions specifically appealing to sceptics, and none (reported) that no conspiracy-type questions specifically appealing to “pro-science” types out of 14 would have been sufficient to bias the results towards “finding” that sceptics are more likely to believe in conspiracy theories.

Climate Change Science Questions

22. I believe that burning fossil fuels increases atmospheric temperature to some measurable degree
23. I believe that the burning of fossil fuels on the scale observed over the last 50 years has increased atmospheric temperature to an appreciable degree
24. I believe that the burning of fossil fuels on the scale observed over the last 50 years will cause serious negative changes to the planet’s climate, unless there is a substantial switch to non-CO2 emitting energy sources
25. I believe that the burning of fossil fuels on the scale observed over the last 50 years has caused serious negative changes to the planet’s climate

There is an complete absence of questions about future projections of accelerating warming; or of future catastrophes well in excess of anything so far observed; of the strength of the science or the uncertainties; our trust in what scientists are telling us; nor of the ability of policy to do anything successfully combat it. These are the questions that many sceptics, including myself, are grappling with. As Warren Meyer concludes, it is the projected catastrophe that sceptics “deny”. Joanna Nova, Lord Monckton, Prof Richard Lindzen, Anthony WattsBishop Hill (Andrew Montford), Prof Bob Carter and Lord Nigel Lawson all recognize to some extent that humans might be causing some global warming and that this may continue.
Many, like Lord Lawson (and myself) conclude that the policies to “combat climate change” are both ineffective and hugely harmful to economic prosperity, yet there is no recognition of this aspect. The whole thrust of the questions appears to be one of polarization, making sure that those who reject the consensus is as large as possible.

Environment questions

26. The problem of CFC;s is no longer a serious threat to the ozone layer
27. The problem of acid rain is no longer a serious threat to the global ecosystem

Two questions on the environment, that quite rightly see where people stand on other environment issues.

Personal Questions

28. In many ways my life is close to my ideal
29. The conditions of my life are excellent
30. I am satisfied with my life
31. So far I have gotten the important things I want in life
32. If I could live my life over I would change almost nothing
39. Out of 100 people in your neighborhood, how many do you think earn more than you do?
40. Out of 100 people in your country overall, how many do you think earn more than you do?

Six psychology questions. They do not appear in the conclusions of the paper. This might be because there was no relationship to respondents’ self-esteem and their views on climate science.

Established Science Questions

33. The HIV virus causes AIDS
34. Smoking causes lung cancer
35. Human CO2 emissions cause climate change
36. Out of 100 medical students how many do you think believe that the HIV Virus causes AIDS
37. Out of 100 medical students how many do you think believe that smoking causes lung cancer?
38. Out of 100 climate scientists how many do you think believe that human CO2 emissions cause climate change?

There are two sections. Three questions on what the respondent thinks about three propositions and three questions of about where the respondent thinks the scientific consensus lies. The questions are somewhat sneaky. That HIV causes AIDS and smoking causes lung cancer is quite clear to the vast majority. But human CO2 emissions causing “climate change” is something more ambiguous to anyone who thinks about the issue. Does a small amount of warming really mean a change in the climate? Is it a change of climate system – from rainforest to savannah for instance? Or is it the same climate type, but with more extreme weather events. As a political concept in the minds of the authors it might be quite clear, but to respondents who have a less polarized view of the world it may not be so clear. The ordering is quite clear though. The questions are viewed by the question-setters are equally valid, so answering the third question differently is indicating to the respondent something of how they are viewed.

Conclusions

The questions appear to have been devised to obtain verification of the hypothesis that rejection of climate science is motivated by belief in free-market ideology and due to a conspiracist ideation. In more colloquial language, the questions were biased to support the view that denial of climate science is due to free-market ideologues who are incapable of evaluating the evidence. The questions on free-market ideology betray the question-setters prejudices. The questions on conspiracy theories are show something of the question-setters own beliefs or a deliberate ploy to bias the results in the desired direction. The questions on climate science show a desire to show consensus amongst pro-science views, along with trying to ignore the possibility that policy questions are a matter of contention as well as the “science”.

Kevin Marshall

AR5 First Order Draft Summary for Policymakers – a few notes on pages 1 to 8

Alec Rawls has taken the brave step of releasing the first order draft of the UNIPCC AR5 Report. Anthony Watts has republished at Wattsupwiththat.

Although Alec Rawls published in breach of signed undertakings, I comment and quote the report in the public interest. There is more than a single, unequivocal, interpretation of the data. To claim otherwise is dogma. This dogma is being used to justify policies that promote net harm to western economies, particularly the poorer and more vulnerable sections of society. In the name of this dogma, impartiality is being annulled and dissenters called nutters.

I have started with some initial observations on the first eight pages on the Summary for Policymakers – the only bit that people ever read. Like utterings from the Kremlin on the 1970s and 1980s, the coded language says as much or more than the actual words.

Major points

  1. No admission of lack of recent rise in the surface temperature record.
  2. But the lack of recent rise is accounted for by a step change in the warming in the Southern Oceans.
  3. AR4 got it wrong on decreasing precipitation in the tropics (which underlay Africagate), and they got it wrong on increasing hurricanes.
  4. Sea level rise is not accelerating. In fact the recent rise since 1993 is similar to the 1930-1950 period.
  5. Global glacier melt is not accelerating. Himalayas do not even get a mention.
  6. Medieval Warm Period gains more recognition than the AR4. However, recent studies will render AR5 out of date before it even published.

Page 3 Lines 21-25.
On temperatures there is a cover-up of the recent lack of warming. They cannot admit that global average temperatures have not changed for 15 years.

Page 3 Lines 38-40. Precipitation in the tropics likely increased over the last decade, reversing a previous trend from mid-70s to mid-90s. The AR4 prediction of some African countries experiencing up to a 50% reduction in crop yields by 2020 (Africagate) was based upon a belief increasing extreme drought.

Page 3 Lines 46-48

Changes in many extreme weather and climate events have been observed, but the level of confidence in these changes varies widely depending on type of extreme and regions considered. Overall the most robust global changes are seen in measures of temperature {FAQ 2.2, 2.6} (see Table SPM.1).

Translation – Saying that an extreme weather events are evidence of global warming has no scientific validity. Best measures are of global temperature, which we can’t admit have been failing to rise.

Page 4 Line 14. An admission that previous IPCC reports got it wrong on tropical cyclones getting more extreme.

Page 4. Lot of stuff on Trenberth’s missing heat being in the oceans. Oceans have been warming since 1971. The lack of warming of air temperatures since the mid-90s could be accounted for by this comment on lines 36-37

It is very likely that the Southern Ocean has warmed throughout the full ocean depth since the 1990s, at a rate of about 0.03°C per decade.

The lack temperature rise is explained by the heating up of the oceans. Global warming is now confined to the Southern Ocean. It is imperceptible, so on the Southern perimeter it is not sufficient to have stopped the increase in Antarctic sea ice from extending slightly.

Then this

Warming of the ocean accounts for more than 90% of the extra energy stored by the Earth between 1971 and 2010. Upper ocean (0–700 m) heat content very likely increased at a rate between 74 [43 to 105] × 1012 W and 137 [120 to 154] × 1012 W for the relatively well-sampled 40 year period from 1971 to 2010. Warming has also been observed globally below 4000 m and below 1000 m in the Southern Ocean, in spite of sparse sampling (see Figure SPM.1). {3.2, Box 3.1, Figure 3.2, Figure 3.3}

The very likely heating of the Southern Ocean, is based on sparse sampling?

Page 4. Line 46. Seas have very likely become saltier. That is has become less alkaline. On Page 6 lines 30-31, Ph decline is 0.015 to 0.024 per decade over last 3 decades. Call becoming less alkaline “acidification”, which is inaccurate. Oceans are heading towards Ph neutrality.

Page 5. Glaciers are globally still shrinking. No mention of Himalayas, and no mention of global acceleration. Range is “210 [145 to 275] Gt yr–1 to 371 [321 to 421] Gt yr–1“. Omit to convert these to sea level rise. 210 Gt = 0.64mm. 421 Gt = 1.29mm (Oceans = 326.2m km2 & 1 Gt water = 1 km3). In old money, glaciers are contributing 2.5 to 5.1 inches per century.

Page 5 Lines 47-49. Sea levels

It is virtually certain that over the 20th century the mean rate of increase was between 1.4 to 2.0 mm yr-1, and between 2.7 and 3.7 mm yr-1 since 1993. It is likely that rates of increase were similar to the latter between 1930 and 1950.

Translation. Sea levels are rising but not accelerating. If sea levels are a lagged response to rising surface temperatures, then (using the HADCRUT3 surface temperature data) we would expect the rise in sea levels to level off in the next few years, unless there is continued warming in the oceans.

Pages 6 to 7 Long-Term Perspective from Paleoclimatic Records

There was a medieval warm period, despite what Micheal Mann and others said in 1998 and 1999. But the MWP is less than the temperatures at the end of the twentieth century. However, due to time schedules for acceptance into AR5, they ignore Christiansen and Ljungqvist April 2012 and Ljungqvist et al 2012. The later, despite including discredited proxies such as Briffa’s notorious Yamal data, quite clearly shows rom 120 proxies that the 10th century had higher temperatures than at the end of the 20th century.


Similarly the Esper et. al 2012 of summer temperatures in Northern Scandinavia will render this part of the report out-of-date prior to it being published.

In 2006 the UNIPCC could bring themselves to bend the rules to allow in a corrupt scientific paper that suited their purposes, but this time they ignore two strong cases that undermine their case. If there is an AR6 around 2020, the UNIPCC will have to face the scientific evidence.

Page 8 The last IPCC report overestimated the impact of aerosols. The net impact of greenhouse gases and aerosols rises from 1.72 W m-2 to 2.40 W m-2. Negative forcings dramatically fall. The positive forcing impact falls, despite the major contributor, CO2 rising from 1.66 W m-2 to 1.82 W m-2. The net impact of CO2 reduces from 100% to around 75% of warming impact. It is no longer possible to talk of “rising CO2” as a shorthand for anthropogenically-caused rising greenhouse gases.

NB – the SPM file I refer to can be accessed below. Please compare my comments with the file.

SummaryForPolicymakers_WG1AR5-SPM_FOD_Final

Kevin Marshall

Lewandowsky on Radio 4 – missing out basic human psychology

Mike Haseler comments upon the appearance of Prof Stephan Lewandowsky on Radio 4 this week.

Lewandowski is a nasty piece of work who set out to fabricate data using bogus questions by which he attempted to prove sceptics are conspiracy theorists. All he managed to prove is that he is incapable of admitting the poor quality of his work. So, imagine my disgust tonight when I heard the BBC were broadcasting some of his material:

“Why do we continue to believe information even when we are told it’s wrong? Claudia Hammond discovers how the brain stores facts and why we don’t erase erroneous explanations.” (all in the mind)

That section of the program wasn’t very interesting (I fell asleep listening) but having had the misfortune to read the scenario before, the gist of it was that sometimes people will use ideas that they have been explicitly told are wrong showing that most people do not trust academics like Lewandowski.

Obviously that’s not what he intended the result to be.

The scenario given was that subjects were told there was a fire in a barn. They were told oil paints were stored in the barn. They were then told they were not stored in the barn (at which point is anyone going to believe the researcher?). Then they are asked why the fire had thick smoke. Lewandowski is trying to prove “false memories” or some such junk, by showing people still use the information that there was oil paints which they have been told is false. The reality is that what he proves is that very often people don’t believe the information the academics force down their throat and they come up with quite plausible explanations (the smoke was caused by the oil paints the researcher told them wasn’t present) which don’t agree with the “truth” ordained to them by academics like Lewandowski. What this clearly shows is that the general public is more inclined to trust their own ideas of what happened rather than rely on academics like Lewandowski when they are so untrustworthy they can’t make up their mind whether there is or is not paint in the barn.

My comment was

Your point about not believing somebody who has fed you false information is an enormously important part of human psychology. In close relationships, such as with one’s partner or a close friend we trust the other implicitly. If that trust is betrayed – such as a wife finding out after many years of marriage that the husband has a mistress – then it is not easily regained. A lot of distrust in climate science is that when the science gets it wrong, or is found giving false certainties (such as Glaciergate and Climategate), the reaction has not been to confess to error, but to sweep the issue under the carpet, or blame others.

Another aspect is that people tend to trust new information from people that they trust and respect, rather than people that they are prejudiced against. However hard we try to be neutral, people tend to more easily accept the words of the politicians that have their world view, than those of the opposite party. A life-long Tory from Haslemere has similar prejudices to a Labour supporter from Middlesbrough. They would far sooner trust a politician from their party than from the other side.

The problem with Lewandowsky is he fails to understand the problems of regaining trust when it has been breached, but instead tries to create prejudice against those who question his dogmatic views.


Has Kevin Trenberth Reversed his position on Reversing the Null Hypothesis?

There is an interesting quote from Kevin Trenberth at SciGuy on Hurricane Sandy

It is true that hurricanes normally recurve and head east, especially at this time of year. So we do have a negative NAO and some blocking anticyclone in place, but the null hypothesis has to be that this is just “weather” and natural variability.

(emphasis mine)

Now would this be the same Kevin Trenberth who just 12 months ago was advocating that we reverse the null hypothesis?

“Humans are changing our climate. There is no doubt whatsoever,” said Trenberth. “Questions remain as to the extent of our collective contribution, but it is clear that the effects are not small and have emerged from the noise of natural variability. So why does the science community continue to do attribution studies and assume that humans have no influence as a null hypothesis?”

Has Trenberth now reversed his position on reversing the null hypthosis?

(I linked to SciGuy from Wattsupwiththat)

Comment made at Jo Nova’s Weekend Unthreaded.

Stephan Lewandowsky on Hurricane Sandy

Jo Nova posts on Stephan Lewandowsky’s analysis of Hurricane Sandy. Below is my comment, with the relevant links.

Lewandowsky has a lot to say about the overwhelming evidence for smoking causing lung cancer, but in substance has just this to say about the impending catastrophic global warming.

Trends such as the tripling of the number of weather-related natural disasters during the last 30 years or the inexorable rise in sea levels. Climate scientists predicted those trends long ago. And they are virtually certain that those trends would not have occurred without us pumping billions of tons of CO2 into the atmosphere.

There are 3 parts to this.

First, the economic analysis of natural disasters is Lewandowsky’s own. He ignores completely the opinions of Roger Pielke Jr, an expert in the field, with many peer reviewed studies on the subject. Pielke Jnr has shown there is nothing exceptional in the normalised cost of Hurricane Sandy. Furthermore, a 2009 report showed that New York is vulnerable to hurricanes, and the shape of the coastline makes it particularly vulnerable to storm surges.

Second, the sea level rise is a trivial issue. From the University of Colorado graph, it is clear that sea levels are rising at a steady rate of 31cm a century.

Third, he claims the predictions of unnamed “experts” have been fulfilled. A balanced analysis would point out that the CO2 levels have risen faster than predicted, but temperatures have not.

Last week I posted a proposal for analysing the costly impacts of global warming. Using the “equation”, I would suggest Lewandowsky overstates both the Magnitude and Likelihood that Sandy was caused by global warming. He misperceives the change in frequency (1/t). Furthermore, given than he has a track record in the highly biased use of statistics in his own field, and his deliberate lack of balance, the Weighting attached to anything he says should be negative. That is, like to newspapers of the Soviet Union, if Lewandowsky claims something, we should read between the lines to see what he does not say. However, unlike the Soviet Union we are still able to look for alternative opinions.


Normalized US Hurricane damage impacts


2012_rel4: Global Mean Sea Level Time Series (seasonal signals removed)

Lewandowsky et al 2012 from two alternative philosophies of science

The following comment was made on Joanne Nova’s blog, in response to a comment by Jonathan Fordsham that Stephen Lewandowsky did not know what he was getting into by publishing his paper and the subsequent defence of that paper.

Whilst Lewandowsky may not have known what he was getting into, the aim of the paper was to find further reasons to dogmatically dismiss any views that question the established orthodoxy. It is from a view of science that sees conformity and belief in that orthodoxy as the mark of a scientist. From this conformity is the importance of opinion polls and declarations of belief by scientific bodies to this view. Promoting evidence or hypotheses that contradicts orthodoxy risks being branded a heretic or denier.

The alternative, “Popperian” view of science is that progress is often made by over-turning existing hypotheses, or subsuming them within more profound theories. Getting results that contradict hypotheses is a cause for celebration. It then raises a whole series of questions. In this view of science, belief in a specific hypothesis is dangerous. People do not like having their beliefs contradicted, and it would be hugely damaging psychologically to constantly attempt to undermine one’s core beliefs. Belief instead is in finding new understanding of the world by the most rigorous method.

The questionnaire, despite all its biases, clearly showed that the vast majority of respondents, whether skeptic or alarmist rejected cranky conspiracy theories. Lewandowsky’s theory about climate “deniers” having a conspiracist orientation was clearly contradicted by the evidence. A team of people then spent 18 months producing the paper. There is strong circumstantial evidence that the time was spent manipulating the data, choosing the best statistical methods to corroborate their story, and carefully phrasing what they wrote to claim the opposite of what the data revealed.

The “orthodox” view of science was clearly Lewandowsky’s enemy when the evidence contradicted his hypothesis. He could not publish the full results for risk of his status as a scientist and for future funding of his work. The “Popperian” view would have still allowed publication, as it falsifies a hypothesis that Lewandowsky and others believe in.

Kevin Marshall.


The Role of Pivot Tables in Understanding Lewandowsky, Oberauer & Gignac 2012

Summary

Descriptive statistics, particularly in the form of pivot tables enable a bridging of the gap between the public pronouncements and the high level statistical analysis that can only be performed by specialists. In empirically-based scientific papers, data analysis by spread sheet enables the robust questions to be asked by the non-specialist and the expert reviewer alike. In relation to Lewandowsky et. al 2012, it highlights the gulf between the robust public claims and the actual opinion poll results on which it is based.

Introduction

In a blog post “Drilling into Noise” on 17 September, Stephan Lewandowsky (along with co-author Klaus Oberauer) makes an interesting comment

The science of statistics is all about differentiating signal from noise. This exercise is far from trivial: Although there is enough computing power in today’s laptops to churn out very sophisticated analyses, it is easily overlooked that data analysis is also a cognitive activity.

Numerical skills alone are often insufficient to understand a data set—indeed, number-crunching ability that’s unaccompanied by informed judgment can often do more harm than good.

This fact frequently becomes apparent in the climate arena, where the ability to use pivot tables in Excel or to do a simple linear regressions is often over-interpreted as deep statistical competence.

Now let me put this in context.

    The science of statistics is all about differentiating signal from noise. This exercise is far from trivial:

A more typical definition of statistics is

Statistics is the study of how to collect, organize, analyze, and interpret numerical information from data.

So Lewandowsky and Oberauer appear to seem to have a narrow and elitist interpretation.

“it is easily overlooked that data analysis is also a cognitive activity.”

Lewandowsky and Oberauer are cognitive scientists. They are merely claiming that this is within their area of competence.

Numerical skills alone are often insufficient to understand a data set—indeed, number-crunching ability that’s unaccompanied by informed judgment can often do more harm than good.

Agreed – but that implies that what follows should demonstrate something unique, they can only be gained by higher level or “scientific” analysis.

This fact frequently becomes apparent in the climate arena, where the ability to use pivot tables in Excel or to do a simple linear regressions is often over-interpreted as deep statistical competence.

I have not found pivot tables used before to analyse data in the climate arena. Nor have I seen simple linear regressions. The heavyweight statistical analysis from those who dispute the science has centred around one person – Steve McIntyre. In fact, to my knowledge, the first instance of when pivot tables were presented are primary analysis by sceptics was when I published my analysis

I would quite agree that pivot tables are not a replacement for deep statistical analysis. But it has role. My analysis using pivot tables, published on 1st September has a number of things which I identified independently which are not brought out in the original paper. These I present below. Then I will suggest how the reporting in the mainstream media might have been somewhat different if they had seen the pivot table summaries. Finally I will make some suggestions as to how the low level statistical analysis can contribute to relating to more “scientific” statistics.

Analysis using pivot tables

How Many Sceptics?

When I first glanced through the paper at the end of July, I wrote

It was an internet based survey, with links posted on 8 “pro-science” blogs. Five skeptic blogs were approached. As such, one would expect that “pro-science” responses would far outweigh “denialist” responses. I cannot find the split.

On obtaining the data, this was what first looked at. In the posting I looked at the 4 Climate Science questions, classifying into acceptors and rejectors (“denialist”) of the science.


Or summarising into 3 categories


Those who dogmatically rejected every question were outnumbered more than 10 to 1 by those who dogmatically accepted. Those who accept the science comprise three-quarters of the respondents. Most people would believe this to be material to a paper analysing those who reject the science.

NASA faked the moon landing|Therefore (Climate) Science is a Hoax

This is the beginning of the title of the paper. Pivot tables are great analysing this. The row labels are “Climate Science Belief”, the columns are CYMoon, and under “∑ values” enter the count of another column of values.

After a bit of formatting, and three more columns of simple formulas, I got this.


Just 10 out of 1145 respondents agree that NASA faked the moon landings. (I was not the first to publish this result. Anthony Watts piped me by a few hours.)

Strictly this is a claim against the “Climate Change” conspiracy theory CYClimChange and CYMoon. I did this table as well


Of the 64 who strongly accept that the climate change conspiracy theory, just 2 also strongly accept CYMOON. Even worse the title is the other way round. So the sample of those who believe NASA faked the moon landings is just 10. The sample size was just too small to make a prediction. Even worse, you could make the wrong result due to the next issue.

Identification of scam responses

One test was to look at the average agreement to each of 12 conspiracy theories that were independent of the climate area. So I rounded the average response to the nearest whole number for each respondent. And then did a pivot table.


I believe I was the first to identify publically the two that averaged 4 on the conspiracy theories and rejected the climate science. These are the two that Steve McIntyre has dubbed “Super-scammers”.

The biggest conclusion that I see is that the vast majority of respondents, no matter what their views on climate, don’t have much time for conspiracy theories. In fact, if you take out the two super-scammers, the most sceptical bunch are the group that dogmatically reject climate science.

This is confirmed if you take the average conspiracy score for each group.


Taking out the two super-scammers brings the average for the dogmatic rejectors from 1.63 to 1.49. With such small numbers, one or two outliers can have an impact on the data.

Measuring up against the public perception

There were two major newspaper articles that promoted the

The Guardian article on 27th July started

Are climate sceptics more likely to be conspiracy theorists?

New research finds that sceptics also tend to support conspiracy theories such as the moon landing being faked

Even a paper such as the Guardian, which prints all sorts of extremist dogma in denigrating sceptics, would have thought twice about publishing that comment if they had been presented with the tables.

The Telegraph article of 28th August included

“NASA faked the moon landing – Therefore (Climate) Science is a Hoax: An Anatomy of the Motivated Rejection of Science”, was based on a survey of more than 1000 visitors to blogs dedicated to discussion of climate change.

An astute reporter, on the basis of my pivot tables, could reasonably ask Professor Lewandowsky how it follows from just 10 respondents who support the idea that “NASA faked the moon landing” that you can make any sort of prediction about beliefs about climate. The questionnaires were placed on climate blogs, not conspiracy-based blogs, so surely any prediction should be framed the other way round?

It also included

The lead researcher, Professor Stephan Lewandowsky, from the University of Western Australia, said conspiracy theories are the “antithesis to scientific thinking” and those who believe them are more likely to reject the scientific consensus that humans contribute to climate change.

“Science is about weeding out bad ideas,” he told The Daily Telegraph. “With conspiracy theories, you start out with a theory and stick to it no matter what the evidence. So it is not that surprising that conspiracy theorists would not accept scientific propositions … If the scientific evidence is overwhelming and you don’t like the conclusion, you have to find a way to reject those findings.”

An astute reporter, on the basis of my pivot tables, could reasonably ask why Professor Lewandowsky is still sticking to his hypothesis when such small numbers support the wacky conspiracy theories. They may then ask a supplementary question. Given that there were 15 questions on conspiracy theories (14 with results reported), and just 5 on free markets, was not the original purpose to establish the conspiracy theory hypothesis and the secondary one on political orientation?

Suggestions for the Role of Low Level Statistical Analysis

In summary, whilst would quite agreeing that spread sheet analysis using pivot tables are not a replacement for deep statistical analysis there are a number of ways where it can be a powerful aid.

Firstly, it is a quick way of getting a sense of what the data is suggesting. Pivot tables can enable a quick summary visually in lots of different ways. It may need additional classifications, such as my acceptors / rejectors. It also needs thought, and an almost a manic sense of trial and error.

Second, it can give a quick comparison to what is being derived from the higher level statistics or modelling. For scientists it is a way of reviewing the data, to make sure that they have the most important points, and have not gone up blind alleys. For non-scientists (and for those scientists reviewing the work of others) it is a way of quickly getting a sense of whether the conclusions are substantiated by the empirical evidence.

Thirdly, and most importantly, it is a means of communicating to the wider public. It provides a bridge between the mainstream media and the scientists. If climate scientists want to win the trust of the wider public, then they need to relate their work in more intelligible terms, capable of being cross-examined. Instead we have the high level models and a then lot of shouting about how wrong and biased are any criticisms. That leads to a lot of scientists, including Lewandowsky, who are totally incapable of perceiving that they could be wrong, or that there could be even modicum of truth in what the critics say. This denial is best summarized in the graphic displayed in the Lewandowsky and Oberauer posting of the “skeptics” view on recent warming trends. It is a total misrepresentation, used as a means of avoiding intelligent discussion.


Kevin Marshall