Notes Labour’s Analysis of the Energy Market

Labour’s Green Paper on Energy has been found by Alex Cull (comment at Dec 2, 2013 at 1:03 PM) at the site “Your Britain“, in the Agenda 2015 section. Having read it, I can see why the Labour Party are not keen for the electorate to find the document. Some quick observations, that I believe are sufficient to show that Labour have not bottomed out the only, let alone the best, explanation of why retail prices have risen so fast in last few years. What this clearly shows is that Labour’s proposed policy freeze is not just misplaced; it is positively harmful to Britain having future low-cost and secure energy supplies.

Note 03/12/13: This post will be added to over the coming days.

Update 04/12/13: Note on declining investment in “clean energy”

Billions not Millions

The Executive Summary states

Lack of competition in the retail market has resulted in consumers paying £3.6m more than they need to each year.

Caption to Table 1 on page 7 states

Lack of competition in the retail market has resulted in consumers paying £3.6 billion more than they need to

Error in Calculation

The source of the £3.6bn is from Which?

The consumer group Which? found that 75 per cent of customers are on the most expensive tariffs offered by suppliers – their standard tariff – and are not getting the cheapest deal in the market. They estimate that since 2011, families across the country have paid £3.6 billion a year more than they need to as a result. That means that households are on average paying £136 each year because the retail market is not working in the way that a competitive market should. If this market was genuinely competitive, energy companies would face stronger incentives to drive their costs down and pass savings to consumers through lower prices and cheaper tariffs; but this is not happening.

That implies that

  1. In a perfectly competitive market, the single price would be the very cheapest rate available.
  2. As a consequence the big six energy companies are pocketing the difference.

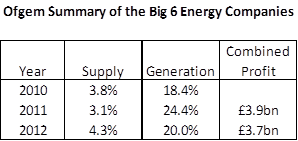
So, there is a monopoly profit of greater than £3.6bn. Ofgem monitors the big six energy firms. The BBC reported on 25th November that

Overall, profits in generation and supply across the half-dozen firms fell from £3.9bn in 2011 to £3.7bn in 2012.

So the competitive market profit fell from £0.3bn to £0.1bn? I don’t think so. The price differential is due to competition working, not due to its’ failure. Like in many areas, if you shop around you can get a better deal than those who do not, as sellers will discount to win your business. If you do not shop around, you will get a bad deal. Look at insurance, hotel rooms, flights or even consumer goods. Reducing competition will cause profits will rise, and the savvy consumer will lose out. Regulate enough and even those who never haggle will not get a good deal.

Decline in those switching suppliers

…. a confusing system of 900 tariffs makes it hard for consumers to actively engage in this market. Since 2008, the number of people switching energy supplier has fallen by over 50 per cent, and switching levels are now at the lowest level on record. Low levels of switching means that the big energy companies have a ‘captured market’ which reduces the incentives to keep prices competitive.

Fig 1 shows a decline in number of people transferring between suppliers between year to year. This shows a decline from around … to …. Is this evidence of a decline?

All other things being equal, then it is evidence of declining competitiveness. But all other things are not equal. A supplier can take action to retain the business. There is passive action and non-passive action.

Passive action is when the customer tries to move away, or threatens to. They are can offered a better deal to retain the business.

Proactive action is to offer the customer a better deal. For instance, I moved supplier in 2012 on a 12 month contract. In July, just before the end of the deal, the supplier offered me their best deal. This I accepted, after a quick check.

A decline in transfers could therefore be due to suppliers taking action to retain custom. This saves on their costs, and consumer’s inconvenience, whilst keeping the market competitive. As the cost to energy companies is less, this can keep overall costs down.

A test of this is to look at the differential between the standard tariff and the competitive tariffs over time for each supplier. If that has widened over time in line with the decrease in those switching then the Labour Party are correct. If it has widened, I would be surprised given the increasing number and sophistication of the price comparison websites. It would be a failure both of government policy over many years and the market to respond to those incentives.

Differential between wholesale and retail prices

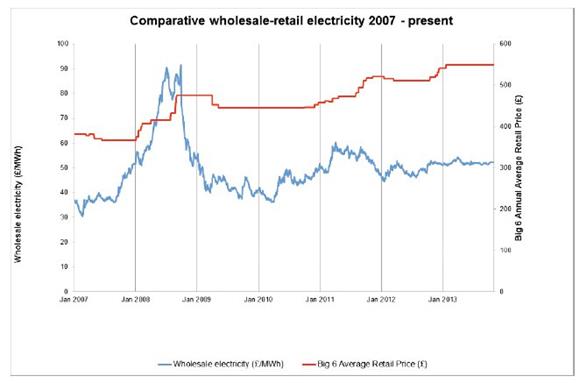
Figure 2 on page 11 is meant illustrate for the electricity and gas markets how the wholesale prices have stayed roughly the same, but the retail prices have widened. The graphic for the electricity market is shown below.

The explanation is as follows.

Wholesale energy prices have been relatively stable since the winter of 2011, rising by an average of 1 per cent a year. However, the large energy companies have increased energy prices by an average of 10.4 per cent a year over this period (Figure 3). This has led to a growing gap between wholesale and retail prices that cannot be explained by the growth in network costs or policy costs which account for 20 per cent and nine per cent of the bill respectively.

So the explanation is derived from the following logic

  1. Prices have risen by over 30% in the last 3 years.
  2. Wholesale prices form the biggest part of the cost to the consumer and have not moved very much.
  3. Other costs have grown, but now only account for 29% of the bill.
  4. By implication, the profits of the energy companies have increased at the expense of the consumer.

Let us first assume that the scales are comparable. The left hand scale is the wholesale cost in £/MWh. The right hand scale in the average annual retail cost per household. In 2010 the average household was paying about £430 for their electricity, compared with £550 in Jan-2013. The wholesale price component rose from around £280 to £310. So “other costs” rose by around £90. This is a huge increase in costs. With around 26 million households, this is around £2.4bn – well on the way to accounting for the £3.6bn claimed above. There is gas as well remember, so there could be an argument.

But what are the other costs?

These include

  1. Standing charges. The costs of operating the National Grid, and replacing meters in homes, along with subsidies for the poor.
  2. Renewables Obligations (RO) and Feed-in-tariffs (FIT). That is the subsidies that the owners of wind turbines and solar panels get over and above the wholesale price of electricity. For instance, operators of offshore wind turbines will get a similar amount in RO as from the market price.
  3. The small, but growing STOR scheme.
  4. The fixed costs of the retail operation. That is the staff to produce the bills, operate the call centres, along with the cost of a sales force to get you to switch.
  5. The net is the retail margin.

Let us assume that “network costs or policy costs” and policy costs doubled in three years as a proportion of the total electricity bill. That is from 14.5% to 29%. That would be £97 of the £90 increase in margin. This hypothetical example needs to be tested with actual data. However, the lack of the rise in profits is corroborated by OFGEM figures for the Big 6 Energy Companies, as I summarized out last week.

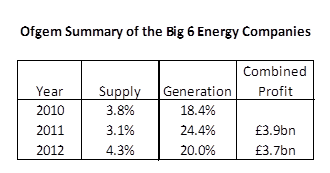
The margins on “supply” have not increased, and are still at the level of a discount supermarket. The margins on “generation” derive from selling at wholesale and the proceeds of the subsidies. Unless Labour are implying that the “Big 6” are guilty of false reporting to OFGEM, the vast majority of the increase in differential between wholesale cost and selling price is accounted for by factors other than profits to the energy companies. Labour are implying the vast majority of the increase in differential between wholesale cost and selling price is accounted for by the profits to the energy companies, and therefore misleading the electorate.

Interpretation of clean energy investment figures

Figure 4 is the following chart

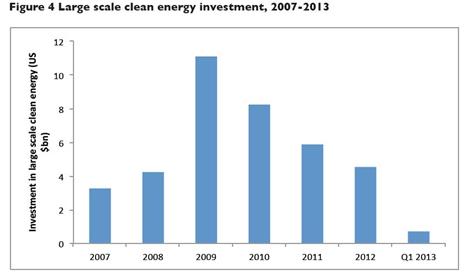
The fall in investment, at a time when it should be accelerating, is a result of the policy environment and protracted decision-making by Government. The Government has been widely blamed for failing to provide the policy certainty needed to de-risk investment.

There is an alternative way to interpret this data. Labour lost the general election in May 2010. What might be more significant is the passage of the Climate Change Act 2008. In the next year investment was nearly 3 times higher, then falling each year since. The Climate Change Act 2008 greatly enhanced the incentives for “clean energy” investment, hence the leap. There are only a finite number of opportunities, so the investment is reducing year-on-year. This being despite the biggest source of revenue coming from index-linked subsidies loaded onto electricity bills. Another reason is that many in the industry saw problems with the technology, that are only now coming to light. In particular the lifespan of the turbines might be shorter than previously thought. Further, the opposition to the wind turbines (where most of the investment is concentrated) is increasing, such as against the proposed Atlantic Array that would have blighted the Bristol Channel. Campaigners are also increasingly concerned about noise pollution.

Therefore, I propose that declining investment is not due to Government spin doctors failing to sweet-talk big business, but due to the reality of “clean energy” turning out to fall far short of the sales patter.

NB First time comments are moderated. The comments can be used as a point of contact.

Kevin Marshall

Ed Milibands claims to have published an “energy green paper” untrue

Update 20.00

I owe the Ed Miliband and the Labour Party an apology with reservations. They did publish an “energy green paper” on Friday. The reservations are

  1. It was published at http://www.yourbritain.org.uk/agenda-2015/policy-review/policy-review/energy-green-paper. (Alexa, has no country data for the site)
  2. My mistake was to use the key words “Labour Energy Green Paper” in my bing search. There is (7pm) no reference to this in the first 50 hits, but there are references to the Labour Party website. Even the Chelmsford Weekly News article (No Alexa country data for this site) makes 20.
  3. The Labour Party Website (UK Alexa rank 9,080) still does not reference the document.
  4. The website referred to on the video (http://www.labour.org.uk/freezethatbill) is inaccurate. It should read http://www.labour.org.uk/freeze-that-bill. Even here you will not find a link to the energy green paper.

My mistake, in accusing Ed Miliband of not publishing the paper when he had, was due to a misconception. I assumed that Labour Party spin doctors would be super-efficient, and so the failure to publish would be due to simple, but embarrassing, clerical errors. Having now read the paper, it would seem to go a bit deeper than that.


Labour’s claim to have published a green paper on energy is untrue. There is no link on the internet to any document, whether freely available, or to purchase.

BishopHill reported on Friday 29th November that Labour Party leader Ed Miliband had launched a “Green paper on energy”, proposing a freeze in energy price is Labour wins power in 2015. At the BBC there is a video of Ed Miliband saying

…and what Britain needs is Labour’s strong and credible plan, that we are publishing today, to freeze energy prices until 2017 and reform a broken energy market so it properly works for business and families.

As I always like to read the original source material, I went to look for it.

Tried at http://www.labour.org.uk/news, which announces:-

The Energy Green Paper sets out the steps a One Nation Labour government will take while we reset the market during the 20 month price freeze to ensure energy is affordable and available…

But no link on the site to a pdf, neither a link to a shop where I might procure a paper copy of the green paper.

It gets worse. In the home page, the lower part for the last couple of days has this:-


It says

Read Ed Miliband’s energy plan

The link is to http://action.labour.org.uk/page/s/energy-calculator/.


No details of the plan. No details of the links to a plan. But there is a link to a video of 1.26 minutes long.

At 1.22 there is a link to “labour.org.uk/freezethatbill”.


This takes me straight back to http://action.labour.org.uk/page/s/energy-calculator. The details do not exist.

Further, there is no link at the BBC, The Mirror, The Guardian, at Sky News, nor a number of other websites that have run the story.

The Labour Spin Doctors have been so concerned to get out the media message, they forgot the substance.

Kevin Marshall


Energy Firms making bigger AND smaller profits

We have heard a lot recently about how rising electricity and gas prices are a result of the large profits of the energy companies. Ed Milliband went on the attack at the Labour Party Conference, proposing a price freeze if Labour gets into power. With energy prices going up 10% a year I wandered how large these profits must be. The BBC today gives some clues.

Regulator Ofgem says the big six energy suppliers saw profit margins in the supply of gas and electricity rise to 4.3% in 2012, up from 2.8% in 2011.

And the watchdog says supplier profit per household customer rose to £53 last year, from £30 a year earlier.

However, the power generation profit margins at the firms fell from 24% in 2011 to 20% in 2012.

Overall, profits in generation and supply across the half-dozen firms fell from £3.9bn in 2011 to £3.7bn in 2012.

So the retail profits have increased, but the overall profits have decreased. This is despite turnover having increased due a large hike in prices. It is a incorrect to say that the double-digit price increases paid for larger profits of the big six energy suppliers. The following tries to explain why.

Ofgem has not uploaded this latest data to its website, so I have to piece together from what is available. Factsheet 118 details the comparison of 2011 with 2010. It says


•     the average profit margin across all six suppliers for

supplying gas and electricity to homes and businesses

declined from 3.8 per cent in 2010 to 3.1 per cent in

2011

•     the margins in generation, however, increased from

18.4 per cent in 2010 to 24.4 per cent in 2011. This is

because of higher wholesale electricity prices. Typical

generation margins also tend to be higher than in supply

to finance the capital investment needed to build power

stations.

A summary of these figures is below


In other words, there is mostly an about face from the very profitable 2011, but still much higher profits than in 2010.

Given that the profits from power generation are much higher, we need to look at this more closely. What should be recognized is the relevant rate of return generation is not ROS (Return on Sales), but ROCE (Return on Capital Employed). An indicator of this can be gleaned from Ofgem’s summaries of the major’s accounts for 2011.

For example, Scottish power has two power sectors. In 2011 it had an EBIT of 168.5 on sales of 1677.0 on “generation” and EBIT of 91.0 on sales of 172.0 on “renewables”. So the older generation has a ROS of just 10%, and the newer, cleaner, renewables a ROS of 53%. To some extent this is not surprising. Renewables – mostly wind turbines – require a huge upfront capital investment, but low operating costs. Also, the renewables capital stock is much newer. But an additional figure is also revealing – the terra-watt hours sold. The “generation” produces £82.60m/TWh, whilst “renewables” produces £101.20m/TWh.

The only other producer to give a split of energy generation is EDF energy, only this time between nuclear and non-nuclear. For nuclear power, the ROS is 40% and £48m/TWh, and for non-nuclear power, the ROS is 10% and £47m/TWh. With Hinckley C, the guaranteed index-linked rate is a minimum £92.50m/TWh.

Thoughts

  1. The large profits are in power generation.
  2. The profits in terms of ROS will increase with new investments, even if ROCE stays the same.
  3. The profits in terms of ROS will additionally increase with the investment in renewables and nuclear, even if ROCE stays the same as initial outlay per unit of electricity is much higher, and the operating costs are tiny, when compared with a coal or gas-fired power stations.
  4. Higher capital investment will mean above-inflation rises in headline profits and ROS, even if the proper measure of profit for generation – ROCE – stays the same.
  5. The responsibility for the Climate Change Act 2008, that generates the higher ROS figures (and much more expensive electricity) is primarily due to the last Labour Government. It was steered through by the then Environment Secretary Ed Miliband. To freeze retail prices will reduce the ROCE of the energy companies, giving a clear signal not to invest in the power generating capacity to stop the lights going out. If you want lower prices and profits, then have a truly liberalized market with fossil fuels given equal status.

Kevin Marshall


John McDonnell should be cast to the political fringes

John McDonell’s jest that if he could go back in time he would “assassinate Thatcher” has caused some, rightfully, harsh words from Iain Dale. Here is my response.

McDonnell should be held up as an extreme element of New Labour thinking. It is OK to say something in jest, no matter how ludicrous, if it generates applause. It is but the uglier side of political spin. We can see through this one, but not as easily see through

1. “Labour Investment v. Tory Cuts”

2. “Beyond boom and bust”

3. Investment with no monetary returns funded through the deficit.

4. Daily government initiatives based on politically funded “research” that any objective researcher would throw in the waste bin.(And were, mostly binned once they had filled the news bulletins for a day).

 Iain Dale and Dan Hannan often have good things to say about their opponents, as did Tony Blair about Mrs Thatcher. If mainstream politicians cannot see the good in mainstream opponents, then they should not be cast to the fringes, for they are unlikely to have the ability to see their own faults. They should not be a candidate for the leader of the opposition.

Cameron gets the message on the Legacy of Labour

David Cameron yesterday started blaming the current deficit problems on the last Labour Government.  Benedict Brogan on his Telegraph Blog quotes Cameron

 “I think people understand by now that the debt crisis is the legacy of the last government. But exactly the same applies to the action we will need to take to deal with it. If there are cuts – they are part of that legacy.”

I have been thinking along the same lines for a while now. See for instance.

https://manicbeancounter.wordpress.com/2010/03/21/the-impact-of-labour-on-the-current-crisis/

https://manicbeancounter.wordpress.com/2010/03/22/the-economic-legacy-of-labour-a-summary-for-the-tories/

https://manicbeancounter.wordpress.com/2010/03/24/the-golden-rule-has-lead-to-economic-ruin/

https://manicbeancounter.wordpress.com/2010/04/04/labour-bashing-business-to-save-facing-their-awful-reality/

I believe it is as important for the future to understand the political element of how Labour went so wrong. The Golden Rule and the denial of the problem until it was too late have made a serious recession into a painful period of painful cuts in expenditure and large tax rises. This nation will be poorer for a generation as a result.

Higher Tax Rates – a Poison Pill for Government Finances?

John Redwood and the Adam Smith Institute may have inadvertently exposed a poison pill left by the outgoing Labour Government.

I completely agree with the contention that in the medium to long term higher tax rates reduce revenue. The ASI obtain this conclusion from the analysis of Capital Gains Tax Rates and revenues over the past fifty years. However, looking at the ASI’s graph on page 3, suggests something important for short-term tax policy as well.

For instance, in 1986, the year before tax rates rose from 20% to 28%, revenue rose 96%. In 2002, the year before tax rates dropped from 20% to 15%, tax revenue dropped 26%.

The expectation of a change in tax rates is highly significant on short–term revenue as people optimise the year in which they declare the capital gains

The UK had just the same effect with income tax in March. The deficit for the last financial year was £11bn lower than forecast in the last budget, (due to higher tax receipts from top earners than expected), and over £20bn lower than forecast last autumn.

In the budget I would therefore expect an adjustment for lower than expected tax revenues from higher rate tax payers in next month’s budget of at least £10bn.

Cutting the Deficit – The PR aspect for the Tories.

There is growing recognition that the job of cutting the deficit will destroy the electoral prospects of those carrying out the task for a generation. Capitalists at work, have (very much tongue in cheek) suggested that a war might be needed to save the next government, much as the Falklands boosted the Tories and helped win the 1983 General Election. A war would certainly help, but such a dreadful circumstance should not be wished upon the nation. The Falklands War was a minor skirmish with a decisive victory that helped topple a dictatorship.

Another way is to encourage the general public to despise Labour – something that Cameron has avoided. There is plenty to go out, for instance:-

  1. The structural deficit (the bit that needs to be closed) is Brown’s fault. I estimate by 2015, around £750bn (over 50%) of the national debt will be as a consequence of the deficits built up in the boom years.
  2. Uncovering the partisan attitudes of the civil service and the political appointees. Encouraging whistleblowers and conducting audits may help.
  3. Launching enquiries and audits into major projects – for instance the widening of the M25, the NHS computer system, GPs pay rises, estimating the cost of Brown’s raid on pensions, why the banks got out of line etc.
  4. Tories emphasising unconditional forgiveness to those who have been taken in by the Labour Spin doctrines that got us in this mess.
  5. Emphasize that Labour have betrayed their core voters.
  6. Launching the initiatives to minimize the pain and maximize the gain from the necessary cuts.
  7. Changing the emphasis from promoting the interests of party/ideology to the government serving the people.


The Tories should do this not only to drive home the contribution that Labour has had in our current crisis, but also to give a positive vision for the future. One where governments will learn from past mistakes and learn the limits of what they can accomplish.

The Two Faces of Labour

The gaffe and very humble apology later by Gordon Brown may have a significant impact on the General Election. But, as I wrote on John Redwood’s blog, there is a deeper public v private face to the Labour campaign.

In recent years our politics has become too like those of the countries that have defaulted in the past – like Brazil, Argentina and like Greece has become now. It has become about presenting a public face of concern and competency, whilst privately just wanting power and prestige. It is also about defending of that image by denigrating the opposition and distorting the reality of events to an extent that George Orwell would not have imagined.

 As a result, we had a structural deficit built up in the boom years and a refusal to recognize that growing debt was an issue. We have delay upon delay about tackling the issue, or even recognizing the problem. Now every minor proposal to tackle it is met with cries of destroying public services and ruined lives.

 The false face of the boom years and the delayed recognition means we have a much bigger problem. It will mean more painful cuts and more growth-damaging tax rises. However, like with personal debt problems, being open and honest there is a severe problem is the first step to solving it. Then you prioritize what is most important, both by area and within each area. That priority should be based on meeting needs – on serving the public – and not on maintaining jobs.

 As part of that recognition, we should divide the deficit between the structural part (using OECD guidelines) and the cyclical part.

 Like with a financial plan for families who have got into debt, we can see, year-by-year, how that deficit is reducing. It should not be enshrined in law, but at least will show how the pain of narrowing the deficit is bringing the nation back to financial health. Then we can also explain how targets are not being met – e.g. through growth faltering, or failing to meet targets.

We need, as a nation, to admit to the false face that all put on. We should now shun the spin, and recognise the poor state of the public finances so that we can repair the damage with the minimum of adverse consequences.

Labour Totally Loses It

Labour seem to have totally lost any sense of proportion when

  1. They talk about less than cuts of 0.5% of GDP sending the UK back into recession when most of that will due to not replacing leavers.
  2. When Gordon Brown is angry about other parties proposed Cuts in child Tax Credits and trust funds. Something that would hit the wealthier families. Or Ed Balls saying it was a “mistake to ghettoise the welfare state”.
  3. They attack the Conservatives innovative education policies, that could push up standards, because of potential minor budget cuts in LEAs that lost pupils.
  4. On cancer care, the target of seeing a specialist within two weeks is mostly met, but survival rates for most cancers are amongst the lowest in Europe.


Until last autumn they refused to discuss how to tackle the £70bn structural deficit they created in the boom years, instead parroting on about “Labour Investment v. Tory Cuts”. They then refused to have a full spending review until after the election.

Labour have further refused to answer questions on the Banks and the Deficit.

Labour are desperate. If they come third, they will be racked by in-fighting more gruesome than in the early 80s. The Lib-Dems will overtake them as the major left-of-centre party.

As a result, Labour lack any sense of proportion. Their very desperation makes them unqualified to govern, or even represent any of the constituencies.


(this is an updated version of a comment made on John Redwood’s blog today)

Lib-Dem Manifesto – an appeal to the Labour Left

After Nick Clegg produced the best performance in last night’s ITV debate, it is time to examine their manifesto. Others has so far failed. John Redwood attacks the £5bn hole in the Lib-Dem figures, but misses the more important bits. Brian Barder on LabourList has clearly not read the Manifesto and Tom Harris thinking that the policies are irrelevant. However, the manifesto is significant for anyone (like me) sad enough to read the thing. In detail it is a direct appeal to the Liberal Left. It is far more re-distributive than Labour, whilst also scrapping some of Labour’s more authoritarian policies like the ID cards.

For instance

–         In the army, reducing the top brass to fund increased pay for the lower ranks.

–         Tax increases for the rich (CGT, pension tax relief, mansion tax)

–         Anti tax avoidance measures.

–         Hitting big business with higher corporation tax.

–         Devaluing the Nations investment in the Banks by a banking levy; by breaking them up; through state sponsored competition in the form of a PostBank; and a UK Infrastructure Bank (high interest safe returns for “green investment”).

–         Cancelling a replacement fo the Trident nulear missile system. They say they will look for cheaper alternatives, but this is unlikely to happen soon with even bigger cuts in other areas necessary to pay it.

Added to this the fact that Labour have created a structural deficit that will undermine public spending for a generation, and you have a strategy to overtake Labour as the party of the left. Perhaps it is Nick Clegg’s strategy to emphasise this in the third debate when Gordon Brown thinks he will avoid Clegg’s criticism.