Extremist Global Warming Paper Taken Down

The Guardian reports that a paper that report predicting that global temperatures would rise by 2.4oC or more by 2020, has now been dropped from the
Eurekalert!, a news service operated by the American Association for the Advancement of Science (AAAS). It was checked by Osvaldo Canziani, Nobel-prize winner and a former co-chair of the UNIPCC.

Problems with the report are

Expert Review

The report was meant to have been checked by Canziani. At a minimum that means that the reports major prediction is validated. As it was based upon the UNIPCC climate assessment report of 2007, then any figures that were substantially out of line should have been carefully justified. Instead, the author, Ms Liliana Hisas, says that instead of withdrawing the report

We are just going to go ahead with it. I don’t have a choice now. The scientist I have been working with checked everything and according to him it’s not wrong.

Therefore, the report is correct because a distinguished person put their name to it. However, they appear not have done basic checks, so the validation process has failed. Very much like the peer review

Ignoring Adaptation

The claim that the 900 million people extra people by 2020 will go hungry relies on some ignoring some basic adaptive facts.

  1. Changes in climate can be partly met by changes in crops. A slightly warmer climate in Europe can be met be changes in crop varieties.
  2. One of the countries with lower yields across crop varieties is Brazil. Having visited Brazil a number of times, I have observed vast tracts of farm land that are underutilized. I have picked oranges from trees that act as wind breaks, and where most of the fruit rots. I have sampled star fruit and large avocados from trees where the fruit is never commercially harvested. Similarly for large papaya, watermelons, bananas and cassava. Increased food prices have been, and will continue to increase outputs. It is not just in Brazil, but in the Russian Steppes, much of Africa and the plains of Canada that agricultural productivity can be increased.
  3. Low productivity is more often due to poor economic policies than natural factors. In the extreme, the greatest famines of the twentieth century are due to the collectivization of agriculture. Even the lesser famine of Ethiopia in 1984, where “only” 500,000 died was partly due to the collectivization policies of the communist government, and the need to feed the city populations where disaffection was centred.

Ignoring the Burden of Government

The claim that the 900 million people extra people by 2020 will go hungry relies not only on the rapid warming claim, but also upon no change in government policy. World food prices have doubled in the last few years due to vast areas being given over to growing fuel for cars. Repealing the subsidies and ethanol content regulations in fuel will release vast acres for food production. Back to Brazil, there are thousands of square miles given over to sugar cane production for ethanol production. Growing food instead in Brazil would probably close half the global gap. In Europe, where the less productive sugar beet is grown for ethanol (or USA where maize is used), then switch to food production could have similar dramatic impacts on food production. A lesser increase in productivity could be made from abandoning organic farming for more intensive varieties. Most studies have shown no difference in quality, or health effects with artificially-fertilized production. Also, by adapting more GM crops, which can vastly increase productivity and provide greater resistance to extreme weather.

Extreme position also requires Extreme Climate Disruption

The claim that the 900 million people extra people by 2020 will go hungry relies is based not only on the rapid warming claim, but also that this results in extreme weather and changed climate patterns. Even if we accept that the 2.4oC+ of warming is likely, the forecast changes in the weather as a result are speculative. Any mitigation policy should cost these as a risk, not as a certainty. The likely cost therefore should be weighted downwards by a risk factor.

Alarmist Policies Discriminate Against the Poor

The report is from a group trying to justify more intensive mitigation policies, whilst believing “in the need for a more equitable society, especially for those living under underprivileged circumstances.” That means that they should consider whether the policies will leave the poor in a worse position than if nothing was done at all. But the main policies of Cap-n-Trade or a Carbon Tax are highly regressive. It is those on the margin who will have to give up their cars and central heating, or hundreds of millions in developing countries who will be denied the opportunities to every obtain what is viewed as the staples of life in Europe. To work, both must impose economic pain, and that pain is greatest for the poor. Furthermore, if policies are imposed that are ineffective in controlling CO2, (such as windmills) then society as a whole will be made poorer for no benefit.


The Universal Ecological Fund (Fundación Ecológica Universal FEU-US) has produced an extremist report in more ways than just having a silly forecast. In failing to consider the wider adaptive ability of the human race, it is overstates both the likely consequences, whilst understating the harm to the poor of the policies it advocates. The author states

“Scientific information is usually not easy to understand. Communicating climate change is often also complicated. As a result, the understanding of climate change has led to misconceptions.”


A report that spreads undue alarmism is the enemy of true science, and will entrench the misconceptions.


Donna Laframboise at

The Full Case for Climate Change Action

Have just reposted a posting by Willis Eschenbach at “Watts up with That”. Eschenbach contends what is lacking in the AGW argument is not just a coherent scientific case. It is also the proper verification and defence of the science. Predictive failures are ignored, and critics vilified.

I made the following comment on the blog.

Might I point out that you have left out a couple of stages?

It is necessary and but not sufficient to

1. Show a strong probability that extra-normal global warming will occur.

2. That if such warming occurs, that it will have catastrophic consequences – with likely impacts in extent and in place.

At this point the Climate Scientists pass the problem over to the economists.

3. Even, if you accept the disaster scenarios, there is no policy available that will contain CO2 at 2 or 3 degrees of further warming, without imposing greater costs on humanity that impose greater costs on humanity than the worst case scenarios. However, some will say that Stern solved this problem and showed this was theoretically possible. However, it was one that would work by hitting the poorest hardest.

4. Even if you accept that a mitigation policy is theoretically possible, it will only work if every country contains their emissions. If the rapidly growing countries, especially China and India, do not contain their emissions then the emissions- cutting of the West will be of no effect. Further, if the policies to not fall into Stern’s maximum cost of $80 per tonne of CO2 saved (The IPCC’s is much lower), then the policies are doing more harm than good.

So there are four stages of this justification – Forecast, consequences, policy and implementation. It is only the first two that the climate scientists have some competency.

Just because a doctor diagnoses a new condition does not give him the instant insight into the cure, nor the ability to know the dosage or the side-effects of any new medicine.

I hope to post a graphical explanation of the AGW case in the coming days or weeks.


BBC Horizon gives a one-sided explanation of temperature

I saw the Horizon programme last night on “What is One Degree?” Ben Miller returned to his physicist routes to explain why a small rise in global temperatures is significant. There was some interesting science, but it fell apart towards the end when it came to explaining how one degree is significant. Using shifts in a binomial distribution curve it was explained that

“You only have to move the average temperature up a bit for the number of stinking hot days to become much more frequent.”


What was not explained was the implication for the other end of the distribution. The number of extremely cold days will become much rarer. For Britain, where snow is fairly infrequent, it could easily become a thing of the past. The cold spell twelve months ago, and December being the coldest in the 352 years that the Central England Temperature Record has been in existence are simply not possible. Especially at the Met Office were repeating this forecast just twelve months ago.

Before you get all skeptical, there is something that salvages the global warming case. The scientific consensus has long stated that climate change will disrupt the planetary weather systems. Therefore, the distribution of temperature will not just have a peak that will shift to the right, the distribution will also broaden. It may broaden sufficiently that there could be more extreme cold weather than extreme hot weather events. Along with this there will be more extreme weather events like hurricanes, tornados, flooding and droughts.

The problem with this is that the prediction of more hurricanes has not occurred. The 2010 season was one of the quietest on record. The forecast drier climate in Queensland seems to have gone a bit adrift as well.

In analyzing our extremely varied climate, whether British or Global, one has to look for instances that contradict out hypotheses as well as confirming instances. Otherwise you get a distorted picture of what is actually happening, and an exaggerated view of the human influences.

AGW – The Limits of the Science

Just posted to Wattsupwiththat.

To say that we cannot make any predictions from models is inaccurate. However, a combination of the scarcity / inaccuracy of data and the highly complex nature of climate systems severely limit what we can be extrapolated. We are restricted to the most basic of “pattern predictions”. With respect to future temperature changes this is most probably restricted to the range of longer-term (30 plus years) trends. Prof. Bob Carter’s analysis is probably as far as we can go on the available data. That is we have a uniform, increasing, average temperature trend over the last 150 years, with 60 year cycles providing deviations around this trend. This trend is unexceptional when viewed from temperature data from ice-cores going back hundreds of thousands of years.

The attempt to cast every unusual weather event in terms of anthropogenic warming, and only selecting the data that fits the theories, not only risks policies that are inappropriate. It may lead us in failing to pick up the signals of potential trends for which the signal is weak, or where detection is from trends or patterns that do not fit theory. For example my house, along with hundreds of others in the area has been without water for over twelve hours now due to a burst water main, caused by the severe cold. A contributing factor to the delay in repair was the lack of resource available. Too much reliance on speculative forecasts of increasingly mild winters, and snow being a rare event has virtually eliminated contingency planning for extreme cold. Yet natural factors (e.g. La Nina, lack of sunspots) would have suggested otherwise.

The AGW science is not only costing us more for fuel. It is also putting us at greater risk of the consequences of extreme weather.

For Robert Carter’s views, see a video at http://video.google.com/videoplay?docid=-1326937617167558947#

Baptist Times – Supporting Global Warming in the Extreme Cold

The front page of the Baptist Times of 10th December has two articles. One on churches helping those affected by the extreme cold snap. The other by Christian Campaigners urging tougher policies at Cancun to counter global warming. Here is my response.

Sir,

There is a distinct contrast in your two articles on the front of the BT of 10th Dec. The major article is of Baptist Churches opening their doors to help those affected by the cold weather. In central England it was the second coldest start to December in the last 350 years. This cold winter is explained by the combination of two natural factors – La Nina and low levels of solar activity.

The secondary article – “Standing up for Creation” – calls for the rich west and emerging India and China, to sacrifice their carbon-fuelled growth and prosperity to stop the global warming and thereby destabilising the climate. In the rich west it means paying more for fuel, something that will hit the poor hardest. In the China & India – with 2 out of 5 of the World’s population – it means preventing tens of millions breaking out of subsistence poverty every year. The policy outcome of Cancun will be more people in this country in fuel poverty, with a near-zero effect on climate change.

History will show that the climate consensus has overestimated our ability to change the climate, both for worse or better. The prophesies of catastrophe will be shown to be as misguided as past prophesies of Armageddon from selective reading of scripture.  We need a more balanced approach.

Cure Worse Than The Problem? – Global Warming and California Prop 21 Compared

Warren Meyer seems to have got a little confused on his blog posting on Judith Curry’s ostracism by the alarmist community. He states

I find it just staggering that Judith Curry, whose hypotheses about man-made global warming probably overlap those of the hard core alarmists by 80-90%, can no longer be tolerated by alarmists.  Much as the Catholic Church radicalized Martin Luther when all he initially wanted to do was reform some practices (many of which the Church later reformed), the attacks on Curry seem to be having a similar effect.

The typical response by politicians, of course, is to try to get more money from taxpayers.  California has a ballot initiative this November proposing to raise vehicle licensing fees to all its citizens in order to fund state parks.  Unfortunately, this kind of funds earmarking by ballot initiative is already threatening to bankrupt California.  One problem with this approach is that it demolishes accountability — once an unelected state agency gets dedicated funds the legislature can’t touch, there is nothing that taxpayers can do if these funds are not spent wisely short of another time-consuming ballot initiative to revoke them.

In the case of state parks, the accountability problem is even worse, as the initiatives replace park user fees, which at least enforce accountability in that users can stop visiting if park services are not up to expectations, with a no-strings-attached bureaucratic windfall.  Compounding the problem, in many states the parks organizations report to rubber-stamp boards rather than the governor or any elected official, so taxpayers have absolutely no path to enforce accountability.


The quotation seems to belong to Meyer’s Coyote Blog. I would direct folks to the Reason Video on this issue.

http://www.coyoteblog.com/coyote_blog/2010/10/coyote-on-reason-tv-private-management-of-public-parks.html

However, maybe, there are just some words missing here, because the funding of state parks and global warming have some common policy issues.

Let me start with Global Warming. The case can be divided into two main areas. There is the science bit (the forecast warming and the catastrophic consequences) and the policy devised as a remedy (divided into the policy itself – the Legislation and actions – along with the expected / actual results). Or more simply Forecast, Consequences, Policy, and Outturn (FCPO).

In the UK, the Stern Review looked at this whole issue as a cost benefit analysis. By assuming fairly alarmist consequences (without the uncertainty) and assumes a relatively cheap (but highly effective) policy fix, gave benefits of the policy are 5 to 15 times the costs. It looks a clear-cut case for action, so anyone who denies this is either ignorant or has ulterior motives. But if you start assessing the uncertainty in the science, you will quickly find unverified hypotheses, implicit assumptions and measurement errors tending in the same direction. Furthermore the climate disruption consequential on this postulated warming is possibly more speculative still.

Even if you accept this worst case scenario with all the damaging consequences as the near certain, there is still the fact that the policies proposed (like Kyoto & Copenhagen) would only be cost-effective if each individual government implemented them like a business plan – maximising revenues and minimising costs. In Britain (with a legislated 80% CO2 reduction by 2050), the levels of costs are often many times the cost boundaries set by Stern, and there are many other costs being incurred that are at best side-shows (targets on recycling, banning incandescent light bulbs, alcohol in gasoline). Yet no Government will implement the policy with the necessary ruthlessness and doggedness required to get the positive results.

Like when Steve McIntyre looked into Mann’s hockey stick, what looks superficially to be robust falls apart when you start looking at it the totality. If absolute minimum for policy is to be an justifiable expectation of improving the likely future state as a result of taking action, then there should be some top-level independent auditing. As no independent review has taken place – like a bank reviewing a business plan to justify a loan – any major gaps or faults in any area potentially undermines the whole case for taking action. But when if the minimum requires accelerating warming, strong positive feedbacks; along with cheap and effective policies and zero issues with policy implementation or cost overruns; then there is a serious problem. So it is only by making a number of extreme and untenable assumptions that the consensus policy be supported. The overall solution is likely to be worse than the actual problem.

How does this relate to California’s state parks? Unlike for global warming, the case for action is clear. The parks need new funding for maintenance. The proposed policy would be ineffective in this, as it is not just funding levels at issue, as part of the cost problem is ineffective management. The solution of separating revenue from paying customers (or the electorate) will exacerbate the management issue. Furthermore, free access to all will increase visitor pressure, potentially hampering conservation efforts, whilst having an element of unfairness towards the inner-city poor. The overall solution is likely to be worse than the actual problem.

Greg Craven’s Grid Extended

Greg Craven published a series of Youtube videos claiming to give a stark a simple choice for any non-scientist to rise above the “shouting match” a beliefs to reach a decision, with confidence as what to do about climate change. By understanding the flaws in his argument it is possible to develop a more sophisticated grid that enables us to make a more rounded assessment of the climate change problem.

Craven’s Grid

Greg Craven is a high school science teacher in Oregon, who has produced a series of Youtube videos (and later in a book), asking:-

“Which is the more acceptable risk?

  • Do nothing and accept the potential catastrophe of global warming?
  • Take action now, potentially harming the economy, but averting potential catastrophe?”

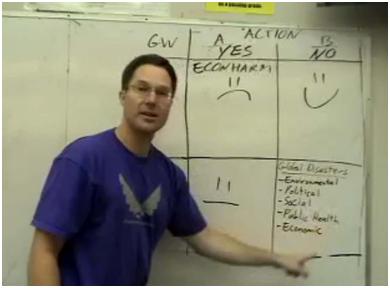
He puts this into a simple grid, with whether to take action along the horizontal axis and whether the global warming hypothesis is true or not on the vertical axis. Recognising that there are costs to combating climate change he allows for the worst case scenario. The cost will be global depression. However, this is as nothing compared with the worst case scenario the scientists are telling us will happen if we do nothing. The choice is stark. We do not know whether the global warming hypothesis is true or false – that is a shouting match that we will get no sense out of – but we should not take a chance, for our own sakes, the sake of the world’s poor and the sake of our children.

Craven’s Grid

Action?

Global Warming?

Lots Now

Little or None Now

FALSE

Global Depression

All Smiles

TRUE

Global Depression – BUT no catastrophe

Mega-Catastrophe

Someone then pointed out a gaping hole in Craven’s argument. This grid could be applied to anything that could potentially happen, no matter how unlikely. He uses the example of an invasion of giant mutant space hamsters. The outcome of everyone on the planet being eaten by such creatures is far worse than the costs of building the necessary defence shield to repel them. We must therefore look at the credibility of those who hold the hypothesis against those who do not. If the backers of the hypothesis are the vast majority of leading scientific organisations, and the opponents are few and far between, then we can give much greater weight to the global warming hypothesis. So the grid becomes like this:-

Craven’s Weighted Grid

Action

Global Warming

Lots Now

Little or None Now

FALSE

Global Depression

All Smiles

TRUE

Global Depression – BUT no catastrophe

Mega-Catastrophe

Craven’s Grid with numbers

Craven’s argument becomes much clearer if we put in some numbers. Let us say that the cost of action is 20, but the impact of the catastrophic warming is 400, or 20 times worse. The basic grid becomes:-

The basic grid, with numbers

Action

Global Warming?

Lots Now

Little or None Now

FALSE

-20

0

TRUE

-20

-400

AVERAGE RETURN

-20

-200

The figures are all negative, as the planet is worse off if catastrophic warming occurs, and the people on this planet are worse off if action is taken. The figure of twenty times worse is the upper limit of cost-benefits from the Stern Review (Tol & Yohe 2006). I chose 20 as a base to save on too many decimals when the grid becomes more sophisticated. (Twenty times of benefits over costs is the upper limit of the Stern Review?) Note that there is now an average return, with equal weighting given to whether the hypothesis is true or false. We end up with an expected cost of not taking action of 10 times greater than if we did. We can now incorporate Craven’s argument is that we should give much greater weighting to the consensus scientists than to the sceptics. Let us say the chances of the hypothesis being true are 4 times that of it being false. The weighted grid becomes:-

The weighted grid, with numbers

Action

Global Warming?

%

Lots Now

Little or None Now

FALSE

20%

-20

0

TRUE

80%

-20

-400

RETURN


-20

-320

So the expected outcome of not taking action is 16 times worse than of not taking action.

Major issues with Craven’s Grid

There are a number of issues with this basic decision-making grid. Most fundamentally, it relies on opinions of opinions. That is of the expert climate scientists convincing the scientists from other fields that they have a convincing case, then getting this much larger group to pass a resolution. If the vast majority of the membership can be shown to have studied this and agreed that the climate science is as strong as in their disparate fields and used for a basis of voting, then this might be a reliable, secondary, source. However, if there is evidence that the resolution is promulgated by a small number of the membership (and the majority not interested enough to oppose); or that there has been outside pressure to pass a resolution; or that there have been efforts to silence critics through abuse; or that pressure groups try to undermine the research grants on which critical scientists depend – then the resolutions should be at a minimum be viewed as worthless. This is along similar as the verdict of a jury in a court of law is viewed as worthless if there is any evidence jury tampering. Most courts would not just nullify the evidence, they may throw out the case, then prosecute those who would try to pervert the course of justice. If there is considerable evidence of this undue influence, then the balance of opinion should swing the other way. If the argument relies on secondary or tertiary opinions, then one should look very carefully at the actual scientific and policy arguments. As Craven does not offer up this argument (just mentions a paper by Richard Lindzen, to then neglect this issue entirely), I shall leave this as argument as just invalid and ignore it entirely. The alternative – to take as circumstantial evidence that the underlying case is weak – would cloud the analysis. Instead I shall concentrate on the science and policy issues. These can be divided into four areas:-

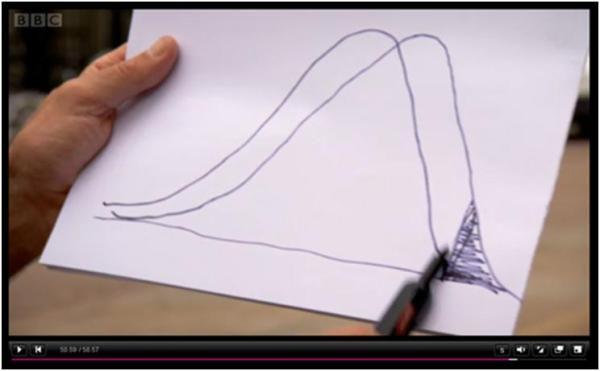
  1. The climate models do not just predict huge rises in temperatures. Rather, they offer up a range of scenarios. The UNIPCC’s scenarios show a greater than 90% chance of temperatures rising between 1.1oC and 6.4oC this century (UNIPCC 2007.1 p8). Both extremes are fairly unlikely. However, if these scenarios were taken to their peak then the distribution of final temperatures would be skewed towards the top end. That is the cut-off of 2099 is likely to be a matter of timing
  2. The consequence of such temperature rise, the models predict, will not simply be higher temperatures, but severe disruption to weather systems. Extreme weather events, like hurricanes, floods and droughts will become far more frequent. Although impossible to predict the extent of climate disruption with each rise degree in temperature, the impacts are more likely to be more towards the exponential than the linear.
  3. Craven appears to assume that the policy proposed will be entirely successful in combating warming. The UNIPCC recognise that this is not realistic. They propose of target of limiting CO2 to 550ppm (twice the pre-industrial levels) warming to 2.0oC. If this policy successfully contains the warming to 2.0oC, then there would still be some adverse consequences to that warming. Further, this proposal must be signed up to by all the nations of the world and then translated into actual policies.
  4. There are also two broad approaches to policy that need to be considered. The most frequently advocated is mitigation – stopping global warming by stopping the rise in anthropogenic greenhouse emissions, or even reducing them. The other is adaptation – adapting to the climatic changes that occur, such as improving coastal defences; changing crop production; improving irrigation systems; and changing house design.
  5. The policy targets then need to be implemented, recognising that often large, and ill-defined government projects poorly managed, tend to over-run on costs and under-perform on benefits. Further, governments may sometimes get freeloaders, who generate costs but do not contribute anything towards the desired outcome.

This gives four areas that can be analysed separately, under the acronym FCPO.

Forecast – How much temperatures are predicted to rise and in what time period.

Consequences – The forecast change in the weather patterns (droughts, floods, hurricanes, etc.), along with the impacts on crop yields, forestation, sea levels etc.

Policy – The adopted remedy recommended to combat the consequences, along with actual legislation enacted and structures created.

Outturn (of the policy) – The actual policies enacted, along the results of those actions – both intended and unintended.

There is a clear dividing line between the climate science (Forecast and Consequences) and the social sciences (Policy and Outturn). The sub-divisions between the Forecast and Consequences and between Policy and Outturn maybe less distinct, but, as later analysis will demonstrate, are useful for purposes of clarity.

Extending the Grid for FCPO

The grid can now be extended include the four elements discussed in a series of stages. We start with Craven’s scenario were a mitigation policy is 100% successful in combating the adverse effects of global warming.

  1. The costs of action

Extending Craven’s Grid by:-

  • Keeping the costs of mitigation to 20.
  • Extending the True / False Scenario to five categories of warming. (None, lower, median, higher & extreme).
  • Including an extra option of “Adapt”. This is split into two parts. First are low cost contingency plans, given a value of 5. Then there are the reactive costs. These costs rise steeply with more extreme climate change.

This gives a revised grid below.

Costs of Action

Category

Extent

Mitigate

Adapt

None

A

None

-20

-5

0

B

Lower

-20

-10

0

C

Median

-20

-15

0

D

Higher

-20

-25

0

E

Extreme

-20

-45

0

RETURN

-20

-20

0

  1. The Climate Change Impact

This shows the impact of taking action. Points to note

  • The extreme case of not taking action is still twenty times the impact of not taking action.
  • Adapting to climate change is only half as effective as mitigation.
  • The likely catastrophic impacts are likely to be non-linear. I have assumed that it will double with each category rise.

    Climate Change Impact

    Category

    Extent

    Mitigate

    Adapt

    None

    A

    None

    0

    0

    0

    B

    Lower

    0

    -25

    -50

    C

    Median

    0

    -50

    -100

    D

    Higher

    0

    -100

    -200

    E

    Extreme

    0

    -200

    -400

    RETURN

    0

    -75

    -150

  1. Net Costs of Action

    Adding 1. and 2. together.

    Net Costs of taking Action

    Category

    Extent

    Mitigate

    Adapt

    None

    A

    None

    -20

    -5

    0

    B

    Lower

    -20

    -35

    -50

    C

    Median

    -20

    -65

    -100

    D

    Higher

    -20

    -125

    -200

    E

    Extreme

    -20

    -245

    -400

    RETURN

    -20

    -95

    -150


  2. Weighted Returns – UNIPCC Scenarios as a basis

    The UNIPCC gives a 90% chance of temperatures rising between 1.1oC and 6.4oC this century. Using this pattern, I assume that the most extreme cases have a 5% probability and the median case as the most likely with a 50% probability. This gives a 20% probability to the lower and higher cases.

    Weighted Net Costs of Action

    Cat

    Extent

    %

    Mitigate

    Adapt

    None

    A

    None

    5%

    -20

    -5

    0

    B

    Lower

    20%

    -20

    -35

    -50

    C

    Median

    50%

    -20

    -65

    -100

    D

    Higher

    20%

    -20

    -125

    -200

    E

    Extreme

    5%

    -20

    -245

    -400

    RETURN


    -20.0

    -77.0

    -120.0


  3. Weighted Returns – Based on Peak Scenario Warming

    As noted above, the final peak temperatures from the models are likely to be more skewed towards the upper end, as some of the peaks are likely to be well after 2010.


    Weighted Net Costs of Action

    Cat

    Extent

    %

    Mitigate

    Adapt

    None

    A

    None

    5%

    -20.0

    -5.0

    0.0

    B

    Lower

    5%

    -20.0

    -35.0

    -50.0

    C

    Median

    40%

    -20.0

    -65.0

    -100.0

    D

    Higher

    40%

    -20.0

    -125.0

    -200.0

    E

    Extreme

    10%

    -20.0

    -245.0

    -400.0

    RETURN


    -20.0

    -102.5

    -162.5

  4. Weighted returns – restricting CO2 to 550ppm

    The policy to mitigate climate change does not have the unrealistic aim of stopping any future warming. Rather it seeks to stabalise CO2 at 550ppm or double pre-industrial levels. This will equate to a temperature rise of around 2 oC. This is around the lower level impacts.

    The climate change impact grid becomes

    Climate Change Impact

    Category

    Extent

    Mitigate

    Adapt

    None

    A

    None

    0

    0

    0

    B

    Lower

    -20

    -25

    -50

    C

    Median

    -20

    -50

    -100

    D

    Higher

    -20

    -100

    -200

    E

    Extreme

    -20

    -200

    -400

    RETURN

    -16

    -75

    -150

    Note that the lower levels have some benefit from the climate change. But mitigation prevents the most catastrophic scenarios.

    The final grid becomes

    Weighted Net Costs of Action

    Cat

    Extent

    %

    Mitigate

    Adapt

    None

    A

    None

    5%

    -20.0

    -5.0

    0.0

    B

    Lower

    5%

    -40.0

    -35.0

    -50.0

    C

    Median

    40%

    -40.0

    -65.0

    -100.0

    D

    Higher

    40%

    -40.0

    -125.0

    -200.0

    E

    Extreme

    10%

    -40.0

    -245.0

    -400.0

    RETURN


    -39.0

    -102.5

    -162.5


The FCPO Grid

The grid derived simply, but effectively summarises the “Consensus” case.

  1. There is a high degree of likelihood that we will have some serious global warming with huge consequences for the planet and the human race.
  2. The best policy is to limit CO2 to double pre-industrial levels. Re-active adaptation strategies are risky and ineffective compared with mitigation.
  3. The expected average costs of doing nothing are far greater than any costs of mitigation.
  4. More importantly than any expected average impact, there is a very real possibility of a massive catastrophe.

What is more it is a way of effectively gauging some of the arguments, underpinned with some risk analysis. By trying to turn the uncertainties into our best-guess risks we can get a more balanced and rigorous assessment of the science than Greg Craven’s. Further, we can also bring into the same analysis the potential effectiveness of any policy, and the project management aspect of delivering the planned results.

However, the ability of this grid to evaluate the science is limited. It can only be used for most top-down or broad-brush aspects. It is a way to get the relative importance of various aspects of science and policy within the totality of the subject, when they are vastly different in degree. If used for splitting hairs, then this will just be another tool to advance the “shouting match”. To focus and clarify the evaluation, a new question is required. “What is the worst that can happen?” is too loaded towards thinking of extreme, but highly improbable, events.

The New Question

To focus and clarify the evaluation, a new question is required. “What is the worst that can happen?” is too loaded towards thinking of extreme, but highly improbable, events. The FCPO Grid looks at both the future scenarios projected by the science and at our collective ability to provide a remedy. There the new question becomes

By taking action, is there, on the balance of the evidence, an expectation that the future state will be improved?

The climate change consensus would contend that this is clear-cut – something that my FCPO grid replicates.


References

Craven, Greg 2007 Jun – Youtube video “The Most Terrifying Video You’ll Ever See

Craven, Greg 2007 Oct – Youtube video “How it all ends

Craven, Greg 2009 – What’s the Worst That Could Happen?

Craven, Greg Website – http://www.gregcraven.org/

Tol & Yohe 2006 – A Review of the Stern Review – WORLD ECONOMICS • Vol. 7 • No. 4 • October–December 2006

UNIPCC 2007.1 – Climate Change 2007: Synthesis Report – Summary for Policymakers (Dec 08 format)