For the first time this report highlights that UK sea level is rising faster than the global average.
As sea levels continue to rise around the UK, the risk of flooding is only going to increase further, says Dr Svetlana Jevrejeva from the National Oceanography Centre.
The examples that the BBC gives of flooding in 2024 at Tetbury and Stratford-upon-Avon are significantly above sea level, and many miles inland. But why let facts get in the way of a good narrative.
On sea-level rise, the Met Office Executive Summary states
Sea level rise around the UK is accelerating.
Since 1901, the sea level around the UK has risen by about 19.5 cm, with two-thirds of this rise happening in just over the last three decades.
The last 3 years were the three highest on record for UK annual mean sea level in a series from 1901, with the 21st Century so far (2001–2024) including the 17 highest years.
Over the past 32 years (1993–2024) UK sea level has risen by 13.4 cm. This is higher than the global estimate of 10.6 cm calculated from satellite altimetry over the same period,
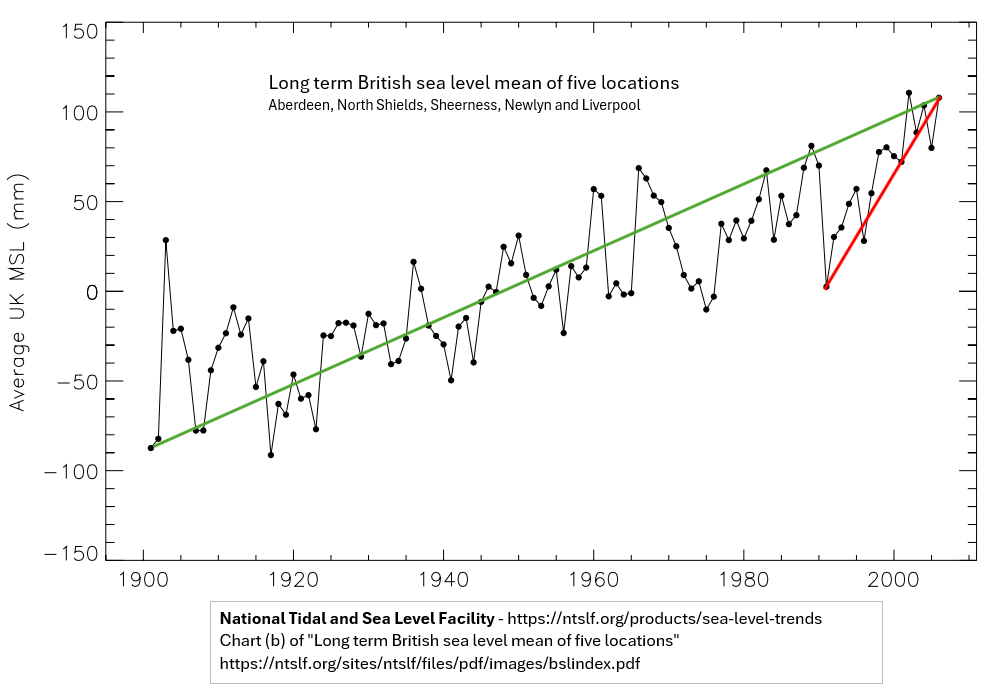
My first reaction on reading this was to assume that the Met Office had copied the methodology of the IPCC AR6 2022. That is, to splice the tide-gauge average data of 1901-1992 with the satellite data from 1993, then hope no one would notice that this splicing accounted for nearly all the apparent acceleration. However, although the year 1993 is there, it is apparent that the comments are derived from a single UK data set. A little research gets a graph of “long-term British sea level mean of five locations” at the National Tidal and Sea Level Facility. I have annotated the graph a little.
The graph does show that 2024 sea levels were about 19.5cm higher than in 1901. But 2024 sea levels were more like 10.5 cm higher than in 1993, not 13.4 cm. Further from 1992 to 1993, sea levels fell dramatically. Almost 7cm, equivalent to a third of the net increase over 124 years. From 1992 to 2024 sea levels rose about 3.8 cm or 1.2 mm yr-1, compared with 1.6 mm yr-1 in 1901-2024. In future Met Office ought to get a professional statistician to calculate trends and perform significance and sensitivity tests on the data. As for the 2024 report, it should be reissued with the unsubstantiated claims about accelerating sea-level rise removed.
This is an expanded version of a comment made at Paul Homewood’s notalotofpeopleknowthat blog.
Britain is heading for “unprecedented” winter rainfall after the Met Office’s new super computer predicted records will be broken by up to 30 per cent.
Widespread flooding has hit the UK in the past few years leading meteorologists to search for new ways to “quantify the risk of extreme rainfall within the current climate”.
In other words, the Telegraph reporting that the Met Office is projecting that if the current record is, say, 100mm, new records of 130mm could be set.
High risk of ‘unprecedented’ winter downpours – Met Office
There is an increased risk of “unprecedented” winter downpours such as those that caused extensive flooding in 2014, the UK Met Office says.
Their study suggests there’s now a one in three chance of monthly rainfall records being broken in England and Wales in winter.
The estimate reflects natural variability plus changes in the UK climate as a result of global warming.
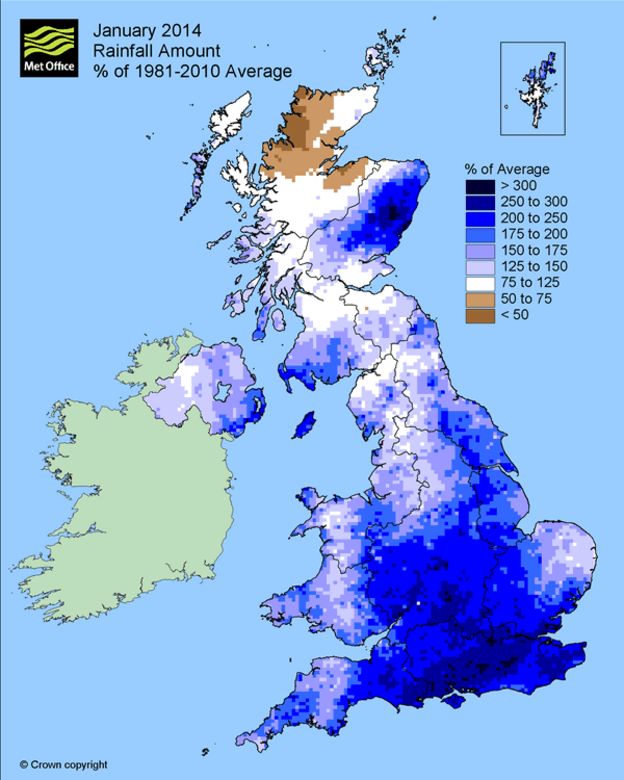
The BBC has a nice graphic, of the most extreme winter month of recent years for rainfall.
The BBC goes onto say
Their analysis also showed a high risk of record-breaking rainfall in England and Wales in the coming decade.
“We found many unprecedented events in the model data and this comes out as a 7% risk of a monthly record extreme in a given winter in the next few years, that’s just over Southeast England,” Dr Vikki Thompson, the study’s lead author told BBC News.
“Looking at all the regions of England and Wales we found a 34% chance of an extreme event happening in at least one of those regions each year.”
Not only is there a greater risk, but the researchers were also able to estimate that these events could break existing records by up to 30%.
“That is an enormous number, to have a monthly value that’s 30% larger, it’s a bit like what we had in 2014, and as much again,” said Prof Adam Scaife from the Met Office.
The 30% larger is an outlier.
But over what period is the record?
The Met Office website has an extended version of what the BBC reports. But strangely no figures. There is a little video by Dr Vikki Thomson to explain.
She does say only recent data is used, but no definition of what constitutes recent. A clue lies not in the text, but an explanatory graphic.
It is from 35 years of winters, which ties into the BBC’s graphic from 1981. There are nine regions in England and Wales by the Met Office definition. The tenth political region of London is included in the South East. There could be different regions for the modeling. As Ben Pile and Paul Homewood pointed out in the comments to the Cliscep article, elsewhere the Met Office splits England and Wales into six regions. What is amazing is that the Met Office article does not clarify the number of regions, still less show the current records in the thirty-five years of data. There is therefore no possibility of ever verifying the models.
Put this into context. Northern Ireland and Scotland are excluded, which seems a bit arbitrary. If rainfall was random, then the chance of this coming winter setting a new record in a region is nearly 3%. For any one of nine regions, if data rainfall data independent between regions (which it is not) it is nearly a 26% chance. 34% is higher. But consider the many alternatives ways for the climate patterns to become more extreme and variable. After all, with global warming there climate could be thrown into chaos, so more extreme weather should be emerging as a foretaste of much worse to come. Given the many different aspects of weather, there could be hundreds of possible ways climate could get worse. With rainfall, it could be wetter or drier, in either summer or winter. That is four variables, of which the Met Office choose just one. Or could be in any 1, 2, 3… or 12 month period. Then again, climate change could mean more frequent and violent storms, such as that of 1987. Or it could mean more heatwaves. Statistically, heatwaves records could be a number of different ways, such as, say, 5 consecutive days in a month where the peak daily temperature is more than 5C about the long-term monthly average peak temperature.
So why choose rainfall in winter? Maybe it is because in recent years there have been a number of unusually wet winters. It looks like the Met Office, for all the power of their mighty computers, have fallen for a common fallacy.
Texas sharpshooter fallacyis an informal fallacy which is committed when differences in data are ignored, but similarities are stressed. From this reasoning, a false conclusion is inferred. This fallacy is the philosophical/rhetorical application of the multiple comparisons problem (in statistics) and apophenia (in cognitive psychology). It is related to the clustering illusion, which refers to the tendency in human cognition to interpret patterns where none actually exist. The name comes from a joke about a Texan who fires some gunshots at the side of a barn, then paints a target centered on the tightest cluster of hits and claims to be a sharpshooter.
A run of extremely wet winters might be due to random clustering, or it could genuine patterns from natural variation, or it could be a sign of human-caused climate change. An indication of random clustering would be to look at many other the different aspects of weather, to see if there is a recent trend of emerging climate chaos. Living in Britain, I suspect that the recent wet weather is just drawing the target around the tightest clusters. Even then, high winter rainfall in Britain high rainfall this is usually accompanied by slightly milder temperatures than average. Extreme winter cold is usually on cloud-free days. So, if winter rainfall is genuinely getting worse it seems that the whole global warming thing for Britain is predicted to become a bit a damp squib.