Revoke Article 50 Petition being dominated by London Labour

There is currently an on-line petition

Revoke Article 50 and remain in the EU

The government repeatedly claims exiting the EU is ‘the will of the people’. We need to put a stop to this claim by proving the strength of public support now, for remaining in the EU. A People’s Vote may not happen – so vote now.

As of noon today it has reached 4.18 million signatures, up from 3 million yesterday morning and just a million two days ago. Guido Fawkes noted that there are a number of foreign signatures, some likely to be fake. A massive EU Second Referendum petition in July 2016 had large numbers of fake signatures created by bots, including large numbers from the Vatican and Antarctica, with at least 77,000 being removed. This might be happening with the current petition. This could be by bots, or by individuals making multiple signatures through using multiple email addresses. I have downloaded the data at around 8am this morning, when there were 3.78 listed signatures, of which 3.64 million were against the 650 UK constituencies.

Analysis By Constituency

I ran the 8am signatures by constituency against data from the General Election 2017, including for the sitting MP, the Political Party in 2017, the electorate and the valid votes cast. I have also used estimated Leave Vote figures by constituency from Politics Professor Chris Hanretty. Although they are estimates, I do believe it is very unlikely that they are more than a few percentage out. An estimated extreme Remain constituency would have been unlikely to have voted Leave. The Constituencies with the top 20 signatures are as follows.

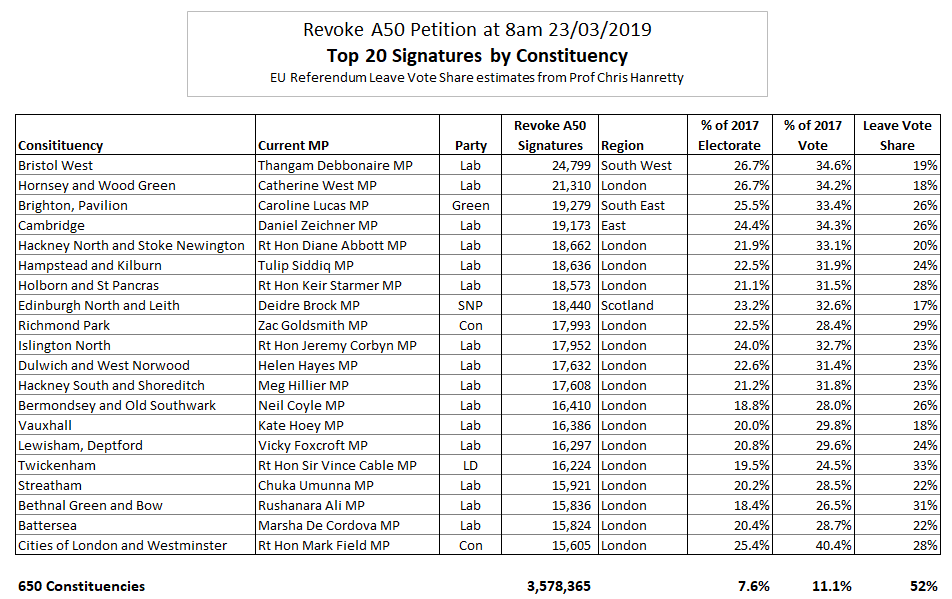
Note that most of consituencies are Labour-held and in London. The constituencies of three key members of the Shadow Cabinet are included. Islington South and Finsbury (Rt Hon Emily Thornberry MP) is number 21 on the list.

Chuka Umunna MP has left the Labour Party. But alongside Caroline Lucas MP and Rt Hon Vince Cable MP, is a non-Labour MP with an extreme pro-Remain stance. All constituencies voted very strongly to Remain in the EU.

I suspect that there is some multiple voting going on. In every single constituency the signatures on an online petition are over a quarter of the number of valid votes in the 2017 General Election. Cities of London & Westminster Constituency exceeds 40%. This is the prime target if you want to send a scam message to the occupants of the Palace of Westminster.

At the opposite end of the spectrum are the bottom 20 constituencies for signatures.

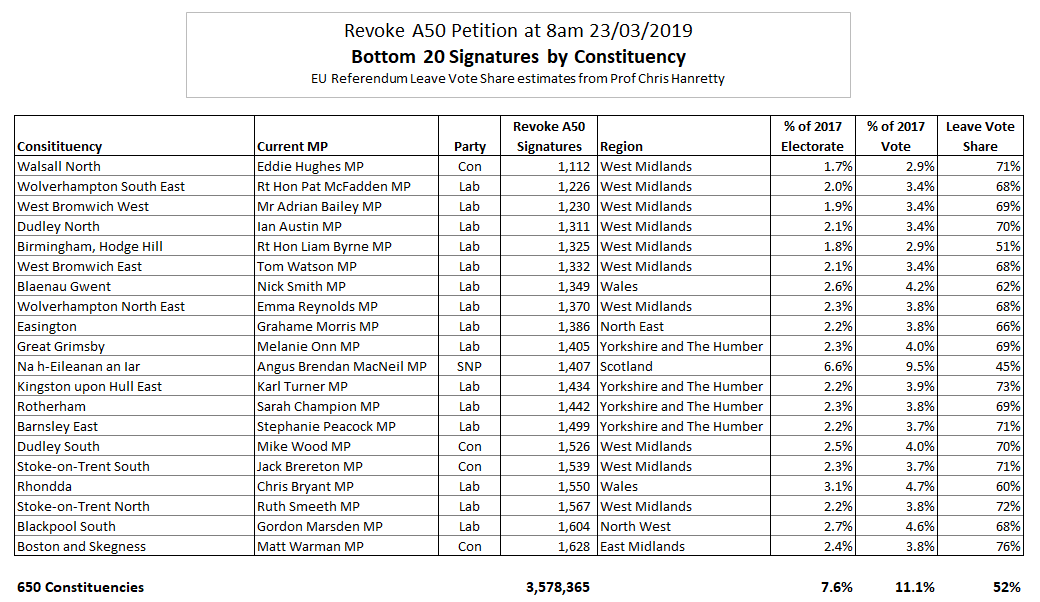
None of the constituencies are in London or South of England. Note that 15 of the constituencies have Labour MPs and are located in the traditional Labour heartlands of the North of England, the Midlands and Wales. Na h-Eileanan an Iar is an exception in that it voted remain. But it is also by far the smallest constituency, so is an anomaly. On average there was a 67% Leave vote.

The dominance of the top 20 metropolitan constituencies had 358,560 signatures at 8am, or 10% of the UK total, compared to 355,526 of the bottom 156 constituencies. Yet in terms of a voice these top 3% of constituencies get represented in the media far more than the bottom 24%. That is a major reason a majority voted to Leave the EU. In many areas people were sick of being controlled by outsiders who have different perspectives, and will not listen to them. The EU Referendum was a big up-yours to the London-based Metropolitans.

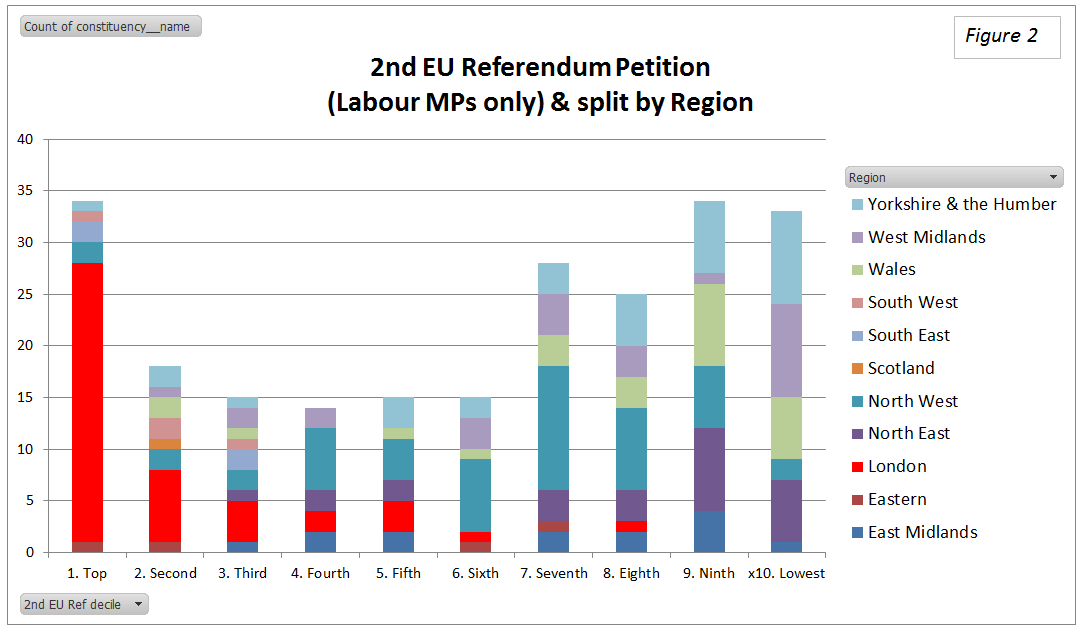
Finally, here is a little pivot table of the bottom 156 constituencies by Region and by Party of the MP.

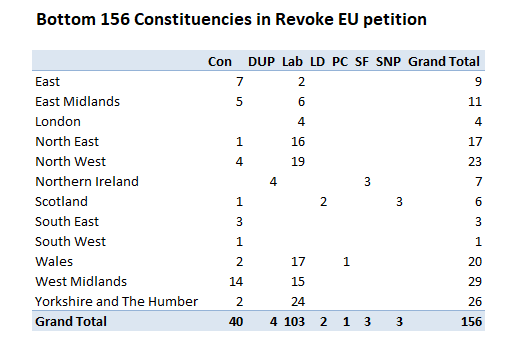
The constituencies represented are just 24% of the total, but around half those in the forgotten regions of Wales, North East, West Midlands and Yorkshire & Humber.

Kevin Marshall

Petitions on EU Referendum and Trump State Visit show dominance of Labour Party by London activists

In the UK it is possible to raise a petition to Parliament. If that petition obtains 10,000 signatures, there is a written response from the Government. If there are more than 100,000 signatures, the matter is discussed in Parliament. In less than two years 48 proposals have been discussed in Parliament, with another 14 pending. By far the largest was for EU Referendum Rules triggering a 2nd EU Referendum, which had 4.15 million signatures. It was never going to get far, as it would have meant changing the rules for the referendum vote after the vote had taken place. But it acted as a protest for the substantial and vocal minority who did not like result.

The signatures by constituency are available for download. There are a also non-UK signatures, which I shall ignore. I ranked the signatures by constituency, and divided the 650 constituencies into tenths, or decile groups. The constituencies I then classified by political party of the current MP, giving the graph shown in Figure 1.

Compared to the Conservative constituencies the Labour Party has a few dominant activist constituencies on in terms of wanting to overturn the EU Referendum results, whilst most are far less active. It is even worse if you include the SNP, many of which were Labour constituencies prior to 2015. Figure 2 splits these 231 Labour seats into the 14 regions.

Of the 34 Labour-held seats in the top decile, 27 are in London. The Labour heartlands of the North of England. parts of the Midlands and in Wales are far less activist. Those 27 London constituencies (or 15% of Labour seats) registered 41% of all signatures in Labour seats. 15% of Labour seats registered slightly more signatures than the lowest 140 or 60%. This lines up with the an analysis of the estimated split of the EU Referendum vote I did last year, and shown again as Figure 3.

The Labour seats that most virulently voted remain in the EU that are unsuprisingly the Labour seats with the most signatories who wanted to overturn the democratic result that goes against them. But it in terms of signatories, London-based activists skew the result even more, meaning that within in a political party their views are likely dominant over the those held in the majority of Labour-held seats. As Labour Party members are mostly pro remain, this means that going with party and not will the majority view in the constituencies that they represent.  There is a similarity with attitudes to Donald Trump’s prospective State visit to the UK. A petition against this is Prevent Donald Trump from making a State Visit to the United Kingdom. This currently has 1.85m signatures up from the 1.82m when I downloaded the figures a few days ago. Figure 4 shows the decile groups by political party of the current MP and the Figure 5 shows the split by region of the labour constituencies.

The Labour constituencies dominate even more the top 65 of constituencies by signatories, with the same 27 London constituencies being represented in the top decile. With 15% of Labour seats they registered 32% of all signatures in Labour seats and registered slightly more signatures than the lowest 144 or 62%. A very similar pattern to the EU referendum.

This petition has been countered by Donald Trump should make a State Visit to the United Kingdom. With just 307,000 signatories or one sixth signatories of the Prevent State visit, it might nor seem as relevant. Figure 6 and Figure 7, are from when the signatories were about 275,000.

The Labour constituencies are fairly united in their apathy for wanting a Donald Trump State visit, but are divided in the expressed opposition to a state visit. But are the far greater numbers of the “Stop Trump” signatories reflected in the wider population? YouGov Published an opinion poll on 1st February on the topic. Almost half the sample thought the state visit should go ahead, whilst just over a third thought it should not. In the detail, the poll also divides the country into five regions, with London separated out. Even here, the opinion was 46 to 38% in favour of the Trump state visit. The real problems for Labour are shown in the extract  of the detail in Figure 8 below.


Those who intend to vote Labour now are a smaller group than those who voted Labour in 2015. Proportionately if 30.4% voted Labour in 2015, 25% would do so now. In the unweighted sample, it implies around 70% of the of the 67 lost would support the state visit. The remaining Labour voters are much more against the majority who expressed an opinion than in GE2015. This indicates a party in general decline. That the opinion seems to be centered on London, this indicates the collapse in the Labour vote has in the traditional Labour heartlands of the Midlands, the North and Wales has further to go.

Yet if the visit does go ahead it is the noisy protesters that will come out in their thousands, the majority will be Labour supporters based in London, who shout down everybody else.