Time to enact the boundary changes for a more level playing field at next General Election

An outcome of the expenses scandal in 2009 both the Conservatives and Liberal Democrats had pledged in their 2010 manifestos to reduce the number of constituencies. The outcome was Schedule 2 of the Parliamentary Voting System and Constituencies Act 2011, with the reduction from 650 to 600, along with a review to achieve more equal constituency sizes. The Boundary Comission published its initial recommendations in 2016, then, following extensive consultations, published revised recommendations in 2018. Given the historically low esteem with which the House of Commons is currently held, and the deadlock on the Brexit issue, perhaps there should be a coming together in the House of Commons to enact these changes to show that they can work together to produce a more level playing field in general elections. The main block on such changes is that greater fairness will lead to shifts in the makeup of Parliament.

2018 Review Changes by Region

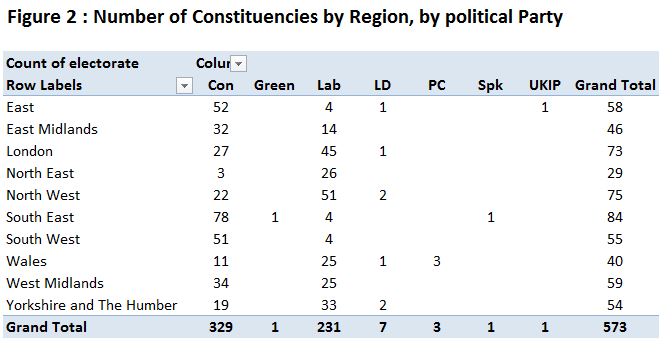
The Boundary Commissions 2018 recommendations, published on 05/09/18 are spread across sites for Wales, Scotland, Northern Ireland and England. Using the results of the 2017 General Election I constructed a table to show the proposed constituency changes by region.

Figure 1 : Proposed Constituency Changes by Region. Additionally is an apportionment of the seats won by Conservative and Labour at GE 2017 on a national and regional basis. As the decrease smallest decreases in seat numbers tend to be in the regions where the Conservatives are stronger, GE 2017 fought on the new boundaries may have given the Conservatives an majority.

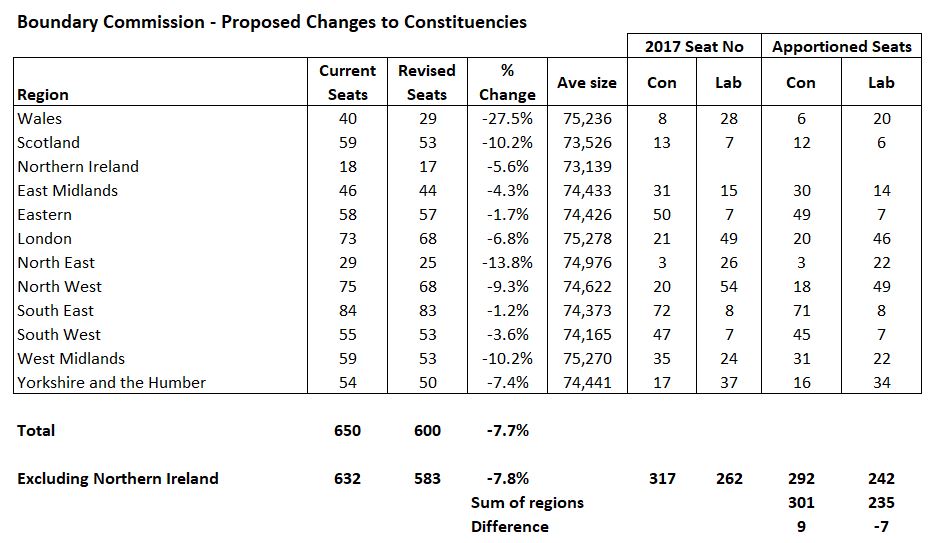
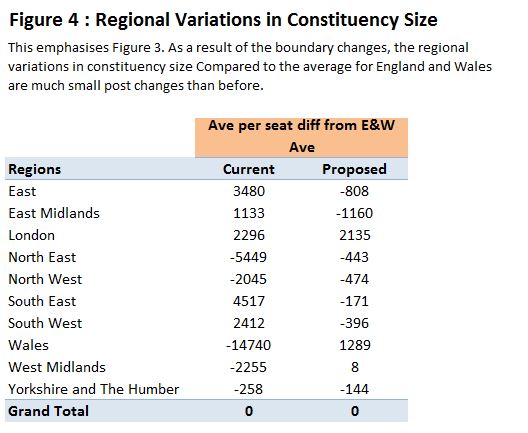
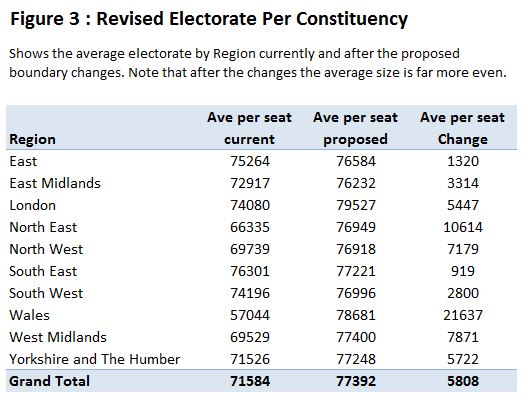
All regions will lose seats in the proposed boundary changes, but the proportionate changes vary considerably. Wales will lose over a quarter of its seats, going from 40 to 29 seats. At the other extreme, the South East, which is already the biggest region, will lose just one seat. The result of implementing the changes would make the average number per constituency across regions far more equal than currently. It should be noted that both Scotland and Wales will still have broadly the same representation per capita in Westminster as England, despite having devolved parliaments.

More detailed analysis from Electoral Calculus

The above gives a general high level impression. The Electoral Calculus website provides a far more detailed analysis through its “Make your Prediction” tool. I first plugged in the results of the 2017 election for the major parties based on the 2017 boundaries at regional level.

Figure 2: Electoral Calculus prediction for 2017 General Election based on 2017 boundaries. The Speaker is included in the Conservative Party Numbers

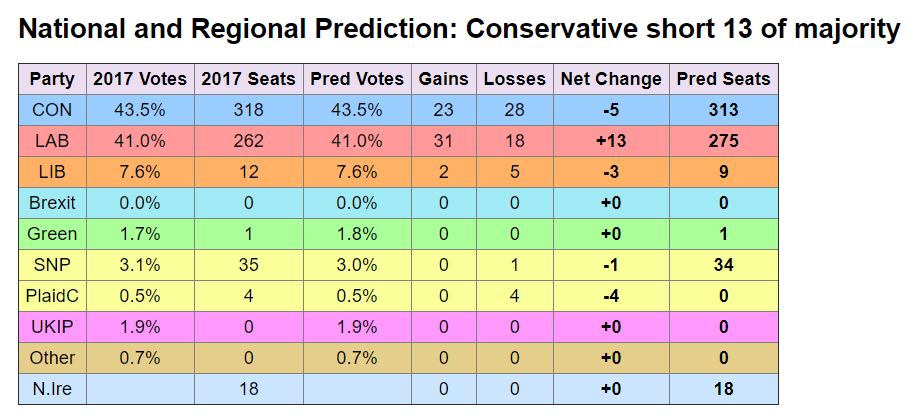
This fairly accurately produces the 2017 result at the top level with a hung parliament. The predictor slightly overstates the Labour seats, fails to predict any seats for Plaid Cymru and understates the Lib-Dem seats for the same reason. That is the support for the parties is more concentrated than the program allows. Plugging in the national results produces the prediction of a small Conservative majority, much for the same reason. The program does not properly allow for concentrated regional or local support.

More interesting is the prediction based on the 2018 boundaries with 600 seats.

Fig 3 : Electoral Calculus’s estimate of the 2017 General Election result against an estimate based on regional party vote share.

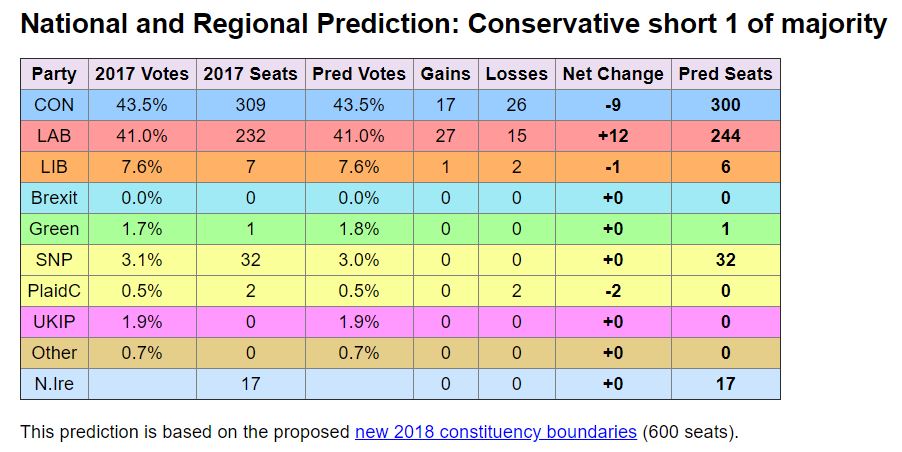
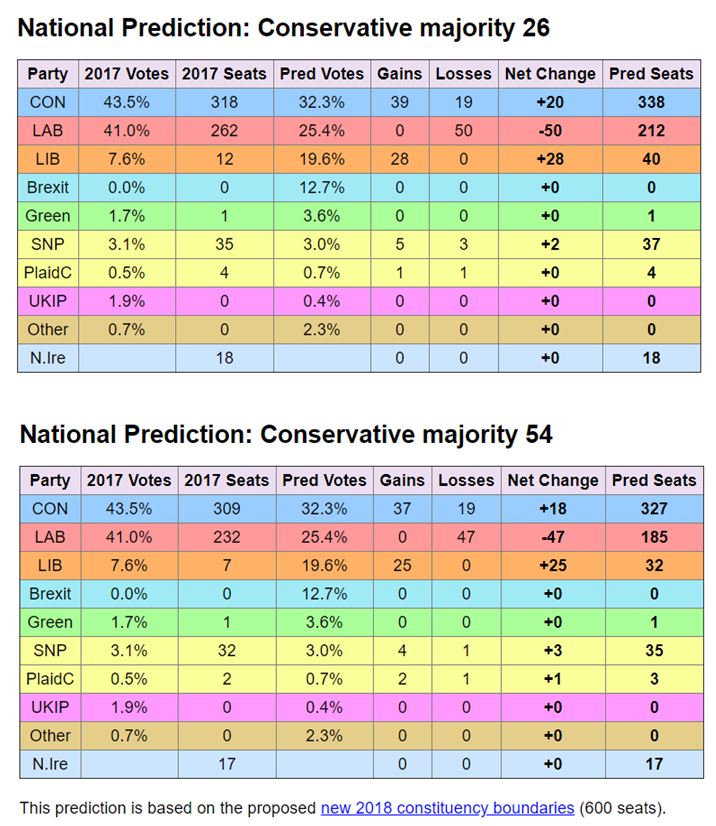
The detailed Electoral Calculus analysis predicts the Conservatives would have been just one short of a majority if the 2017 General Election has been fought on the 2018 600 seat boundaries, or two short if the Speaker is excluded. The national predictor shows a majority of 12. These figures are very similar to my rough estimates above, with a slight Conservative bias in top level forecasts. Given that both the main parties have seen losses of MPs, on these figures neither would see a large net loss of sitting MPs, provided that both Labour and Conservatives were in a similar position in the polls to 2017. However, this is not the case. Electoral Calculus, based on opinion polls from 03 Sep 2019 to 27 Sep 2019, predict a Conservative majority of 12. Plugging in the national vote shares into the predictor, I get a Conservative majority of 26. Using the 2018 Boundaries, with 600 seats the majority increases to 54. Conservative seat share rises from 52.5% to 54.0%, whilst Labours seat share falls from 32.6% to 30.8%. A more level playing field works in the Conservatives favour. However, the bias in the predictor means that the difference is likely smaller.

Fig 4 : Based on opinion polls from 03 Sep 2019 to 27 Sep 2019, Electoral Calculus national GE predictor based on current 650 seat parliameny and 2018 constituency boundaries

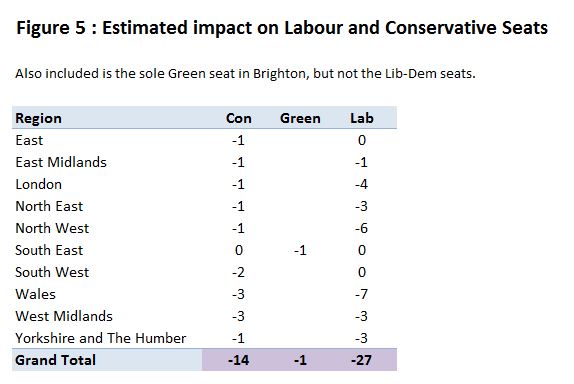
However, voting for fairer boundaries should not be based on immediate polling. One would hope that HM’s Official Opposition would have ambitions of winning and election in the future. What would be the impact of swapping the poll positions of Conservatives and Labour? Figure 5 does just that.


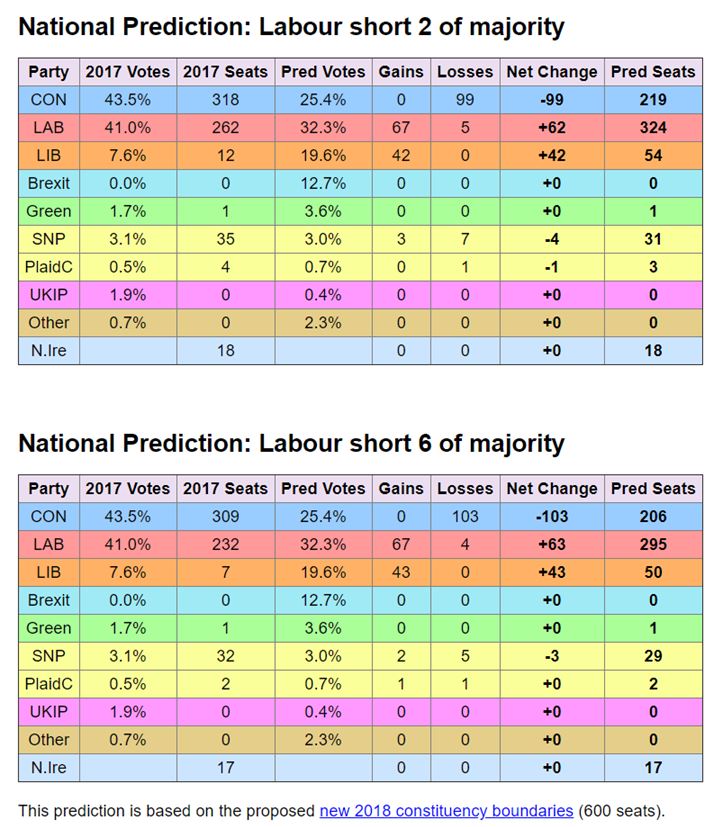
Fig 5 : Same assumptions as fig 4, with the exception that polling positions of Conservatives and Labour are reversed.

If the polling positions of Conservatives and Labour were reversed then the Labour Party would be in a similar position to under the existing system and under the 2018 constituency boundaries with 600 seats. This is however a likely scenario under the current circumstances. Allowing for a Conservative bias in the Electoral Calculus estimates, Labour would likely obtain an overall majority. If Conservative votes fell away, they would mostly go to the Brexit Party, whilst gains for Labour would come from the Liberal Democrats. In the final figure I also assume that the Brexit Party are up 5% and the Lib Dems down 5%.

Fig 6 : Same assumptions as fig 5, with the exception that Brexit Party are up 5% and Lib Dems down 5%.

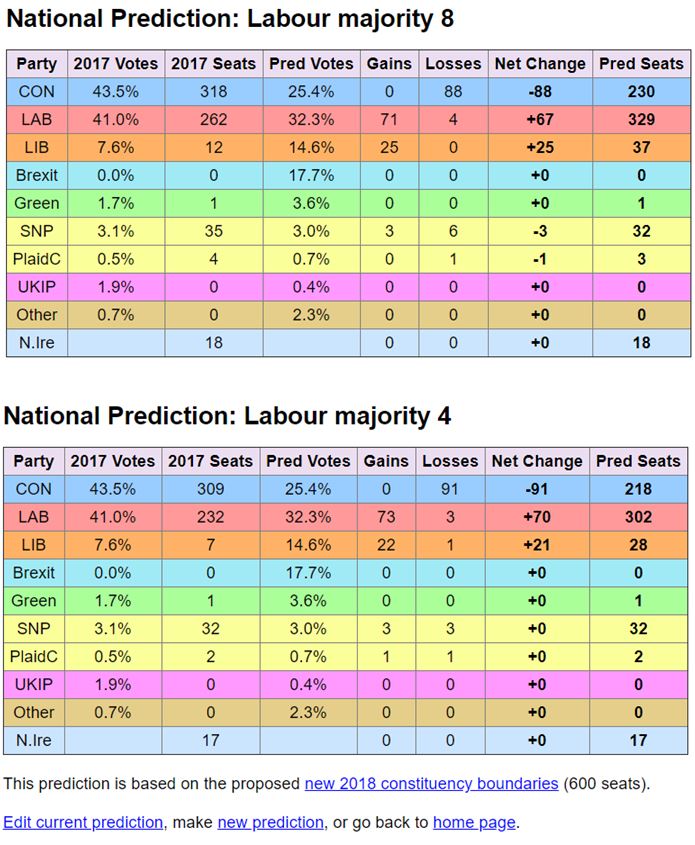
This marginally improves Labour’s position at the expense of the Lib Dems, sufficient to gain a slim overall majority. Again, allowing for the Conservation bias in the figures, the majority would be less marginal.

The Labour party bias under the current boundaries

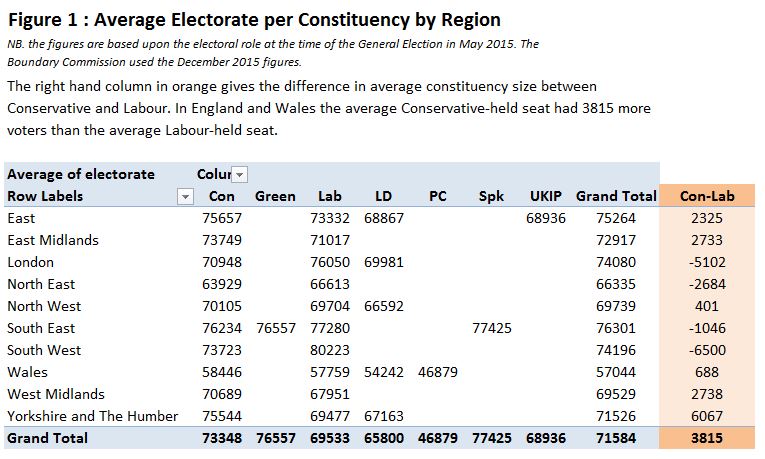
Although the Electoral Calculus figures have a slight Conservative bias, the Boundary Comission changes will favour the Conservatives over Labour. Figure 1 indicates part of the issue. In Wales, the North West and the North East are regions have both larger than average falls in the number of seats and where Labour have a clear majority of the seats. Conversely in the Eastern, East Midlands, South West and South East Regions have both much smaller than average falls in seat numbers and where the Conservatives have a clear majority of the seats. The current constituency boundaries have a Labour Party bias that will be rectified. I have created a couple of charts from the General Election 2017 results, one of which amplifies the current Labour bias in the voting figures.

Fig 7 : From the 2017 General Election results, bands of the percentage of valid votes gained by each party. The upper chart is the count of seats in each band. The lower chart shows the average constituency size.

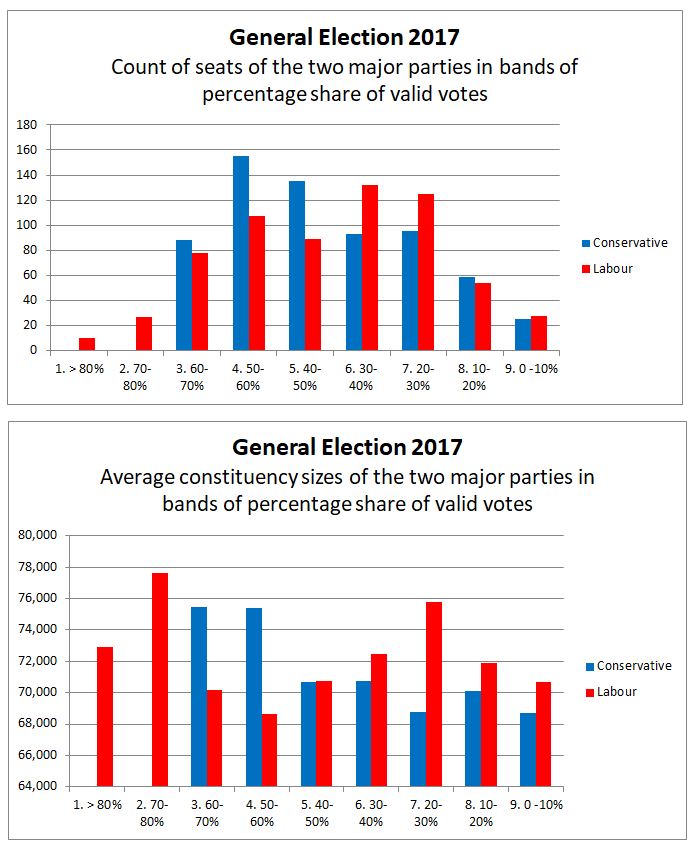
In 2017, the Conservatives achieved at least 50% of the vote in 243 seats. For Labour it was 222 seats. The Conservatives gained 40-50% of the vote in 135 seats, winning 71. Labour gained 40-50% of the vote in 89 seats, winning 35. The problem for Labour is that their vote is more highly concentrated than the Conservatives. Thus they need a higher share of the national poll, on a uniform swing, to gain a parlimentary majority than the Conservatives under current boindaries. Put another way, on average the Conservatives gained 55.46% of the valid vote in the constituencies they won, whereas Labour gained 59.33%. Of course the greater spread of votes across constituencies works in the Conservatives favour in winning elections, but against them relatively if party support drops below 25%. Conversely the current boundaries work in Labour’s favour in the event of a poll collapse, but it is mostly due to their concentrated support.

The lower chart illustrates the problem for Labour from the boundary changes. Whereas the average constituency size where the Conservatives recieved > 50% of the vote in 2017 is 75,400, for Labour it is 70,500. Under the 600 seat Parliament, whereas the Conservatives would retain 243 such seats, Labour would expect to only recieve 208 seats, a loss of 14. For the seats gained with less than 50% of the vote the Conservatives would expect to go from 74 to 71, whilst Labour from 40 to 38. Thus in a 600 seat parliament the Conservatives would expect to have 314 seats, as against 317 seats in a 650 seat Parliament. Labour would go from 40.3% of the seats to 41.0% on the same rough calculation.

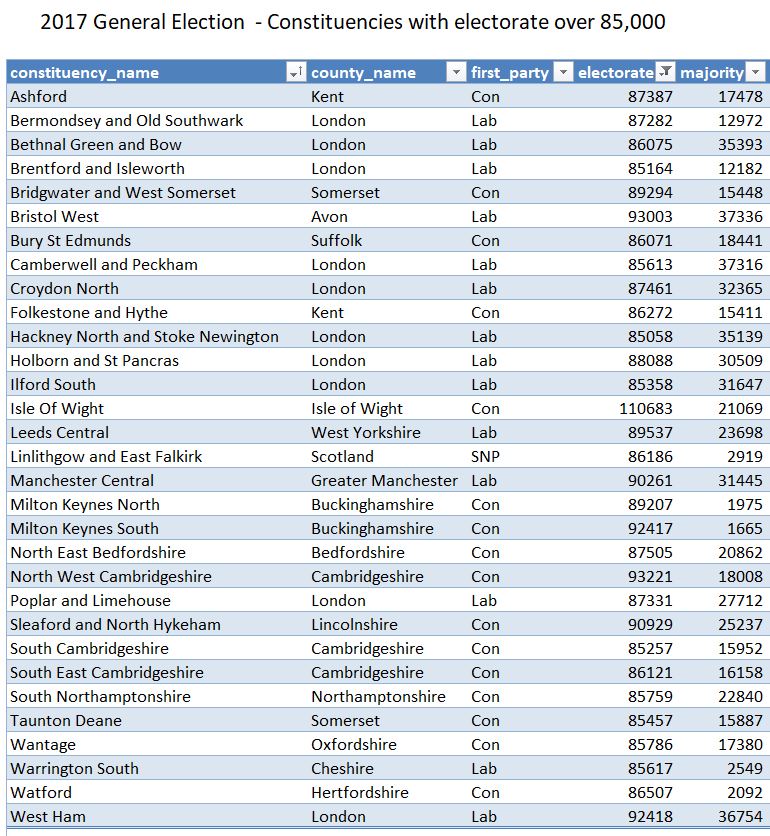
Finally, there is another paradox. Although, on average, Labour constituencies have a smaller electorate than Conservative ones, of the 31 seats with an electorate over 85,000, 14 are Labour. There are three Labour seats with over 90,000 voters – Bristol West, West Ham and Manchester Central. It is not an even picture across the country.

Concluding Remarks

It is now eight years since legislation was passed to reduce the number of constituencies from 650 to 600, along with making them more equal in size. Had the 2017 election been faught on this more level playing field it is most likely that the Conservatives would have been returned with a small majority rather than losing that majority. The impact of enacting the changes would be to counter the relative discrimination that much of the South and East of England has in general elections due to having larger average constituencies. Most of all it would be of benefit to those in the 31 constituencies with over 85,000 voters, listed below.

Fig 8 : The gemeral election 2017 results for the 31 constituencies with electorate of over 85,000.

Kevin Marshall

Jeremy Corbyn needs to do the Maths on Boundary Commission Proposals

In my previous post I noted how some Labour MPs were falsely claiming that the Boundary Commission’s recommendations for England and Wales were party-political gerrymandering. Labour Party Leader, the Rt Hon Jeremy Corbyn MP makes a quite different claim to some of his more desperate MPs.

Corbyn claims that since last December (which the Boundary Commission used as a basis of the boundary changes) the electorate has grown by two million people. That is nearly 5% of the electorate. As a result of the wrong figures “you cannot deliver a fair and democratic result on the basis of information that is a year out of date.
Actually it is possible for it to be fair and democratic if the growth in the electorate is evenly spread across the country. That should be a default position that Corbyn needs to disprove. The question is, how much would the imbalance have to be to wipe out the disadvantage Labour gets from the boundary review – a disadvantage due to current 231 Labour seats in England and Wales having on average 3515 fewer constituents than the 329 Conservative seats in May 2015. Let us do the maths, ignoring the 13 seats held by other parties and the Speaker. To even up average constituency size Labour constituencies would need about 812,000 extra voters (231 x 3515), and for the rest of the two million to be evenly spread between the other 560 constituencies. That is about 2120 extra voters. It is not impossible that the average Labour constituency has added 5635 to the electoral roll (>8% extra) and the average Conservative constituency has added 2120 to the electoral roll (<3% extra). Winning the millions on Lotto is not impossible either. But both are highly unlikely, as the reason for the Boundary Review is that Constituency sizes have diverged, with greater growth in the South of England than in the North of England and Wales. So like other Labour MPs, Jeremy Corbyns’ opposition to the Boundary Commission’s proposals seem to be opposition to greater equality and fairness in the British democratic processes.
Two graphs to illustrate this point. Figure 1 from the previous post shows the average constituency size by party and region.

Figure 4 from the previous post shows that average constituency size per region is made much closer to the average constituency size for England and Wales in the proposed changes.


Kevin Marshall

Are the Proposed Boundary Changes Designed to hurt the Labour Party?

Yesterday the proposed new boundaries for England and Wales were published by the Boundary Commission. Nationally the total number of constituencies will be reduced from 650 to 600, still leaving Britain with one of the largest number of representatives of any democratic parliament. In England the reduction is from 533 to 501 and in Wales from 40 to 29. The UK Polling Report website reports

The changes in England and Wales result in the Conservatives losing 10 seats, Labour losing 28 seats, the Liberal Democrats losing 4 and the Greens losing Brighton Pavilion (though notional calculations like these risk underestimating the performance of parties with isolated pockets of support like the Greens and Lib Dems, so it may not hit them as hard as these suggest).

The Guardian Reports under the banner Boundary changes are designed to hurt us at next election, says Labour MP

Jon Ashworth, the shadow Cabinet Office minister leading the process for Labour, said the party was convinced the proposals were motivated by party politics.

The Manchester Evening News carries this comment

Jonathan Reynolds, Labour MP for Stalybridge and Hyde, accused the Conservatives of ‘old-fashioned gerrymandering’.
I will contest these proposals, because I believe they are a naked attempt to increase the electoral prospects of the Conservative Party at the expense of coherent parliamentary representation,” he said.

This are quite a serious claim to make, particularly as the Boundary Commission clearly states

The Boundary Commission for England is the independent and impartial body that is considering where the boundaries of the new constituencies should be. We must report to Parliament in September 2018.
In doing so, we have to ensure that every new constituency has roughly the same number of electors: no fewer than 71,031 and no more than 78,507. While proposing a set of boundaries which are fairer and more equal, the Commission will also try to reflect geographic factors and local ties. The Commission will also look at the boundaries of existing constituencies and local government patterns in redrawing the map of parliamentary constituency boundaries across England.
In undertaking the 2018 Review, we rely heavily on evidence from the public about their local area. Though we have to work within the tight electorate thresholds outlined above, we seek to recommend constituency boundaries that reflect local areas as much as we can. You can find more detailed guidance in our Guide to the 2018 Review.

I thought I would look at the figures myself to see whether the Boundary Commission has done a fair job overall, or has basically lied, providing a deliberately partisan result, that the UK Polling Report has been complicit in supporting.
For previous posts I downloaded the results of the May 2015 General Election by constituency. I then spilt the results into the regions of England and Wales.
Figure 1 shows the average size of constituency by Region and Party. Spk is the Speaker of the House of Commons.

On average the Conservative held constituencies had 3815 more voters in than Labour held ones. But there are large regional differences. Figure 2 shows the number of constituencies by region and political party.

In the South East and South West, where Labour have larger average constituency sizes they have very few seats. In these regions, the regional average seat size is greater than the England and Wales average, so there will be proportionately less seat reductions. The Conservatives, with the vast majority of seats in these regions do not lose from a reduction in the national total and a more equitable distribution. In the East Midlands, West Midlands and Yorkshire and The Humber, Labour are well represented, but have smaller average seat sizes than the Conservatives. In the North West and in Wales Labour are well represented, the average seat sizes in Labour seats are similar to Conservative seats, but the regional average seat sizes are smaller than the England and Wales average. Smaller average seat sizes in these regions will hit Labour harder than the Conservatives due to Labour’s higher representation.
The only exception to the England and Wales picture is London. The region has larger than average constituencies at present, the average constituency size of Labour constituencies is bigger than Conservative constituencies and over 60% of the 73 constituencies are Labour held. But still the region and Labour lose seats, though proportionately less than elsewhere.
The effect of the revisions in shown in the average seat size. In Figure 3 with less seats the average seat size increases, but in some regions by far more than others, resulting in much less regional variation from the proposed boundary changes.

Figure 4 emphasizes the more even distribution of seat size. Currently, the variation of average constituency by region from England and Wales average is between -14740 (Wales) and +4517 (South East). Under the proposals, the variation is between -1160 (East Midlands) and + 2135 (London). https://manicbeancounter.files.wordpress.com/2016/09/fig4variationewave.jpg

In London’s case it could be argued for another two constituencies, but this is hardly significant. Also, given that London MPs spend their week far nearer to their constituents than any other region, an extra 2-3% of people to represent is hardly a burden.
Finally I have done my own estimated impact on Labour, Conservative and Green seats based on changes in regional seat average sizes in Figure 5. If though I do not include the Lib-Dems, the results are very similar to UK Polling Report. The much more even (and therefore fairer) distribution of seats, along with a modest reduction in the total, disadvantages the Labour Party far more than the Conservatives, despite having two-thirds of the seats.

The Labour Party MPs who are doubting the independence of the Boundary Commission should apologize. The evidence is clearly against them.

Kevin Marshall