Last month Paul Homewood at Notalotofpeopleknowthat looked at the temperature data for Paraguay. His original aim was to explain the GISS claims of 2014 being the hottest year.
One of the regions that has contributed to GISS’ “hottest ever year” is South America, particularly Brazil, Paraguay and the northern part of Argentina. In reality, much of this is fabricated, as they have no stations anywhere near much of this area…
….there does appear to be a warm patch covering Paraguay and its close environs. However, when we look more closely, we find things are not quite as they seem.
In “Massive Tampering With Temperatures In South America“, Homewood looked at the “three genuinely rural stations in Paraguay that are currently operating – Puerto Casado, Mariscal and San Juan.” A few days later in “All Of Paraguay’s Temperature Record Has Been Tampered With“, he looked at remaining six stations.
After identifying that all of the three rural stations currently operational in Paraguay had had huge warming adjustments made to their data since the 1950’s, I tended to assume that they had been homogenised against some of the nearby urban stations. Ones like Asuncion Airport, which shows steady warming since the mid 20thC. When I went back to check the raw data, it turns out all of the urban sites had been tampered with in just the same way as the rural ones.
What Homewood does not do is to check the data behind the graphs, to quantify the extent of the adjustment. This is the aim of the current post.
Warning – This post includes a lot of graphs to explain how I obtained my results.
Homewood uses comparisons of two graphs, which he helpful provides the links to. The raw GHCN data + UHSHCN corrections is available here up until 2011 only. The current after GISS homogeneity adjustment data is available here.
For all nine data sets that I downloaded both the raw and homogenised data. By simple subtraction I found the differences. In any one year, they are mostly the same for each month. But for clarity I selected a single month – October – the month of my wife’s birthday.
For the Encarnacion (27.3 S,55.8 W) data sets the adjustments are as follows.
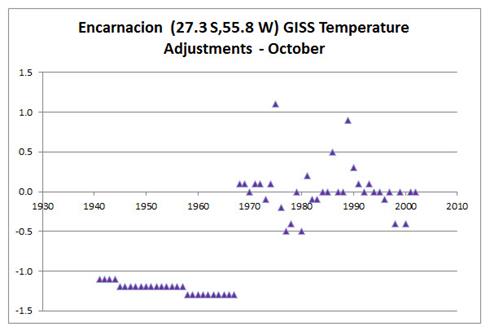
In 1967 the adjustment was -1.3C, in 1968 +0.1C. There is cooling of the past.
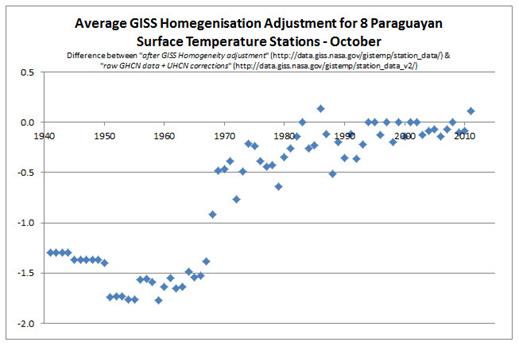
The average adjustments for all nine data sets is as follows.
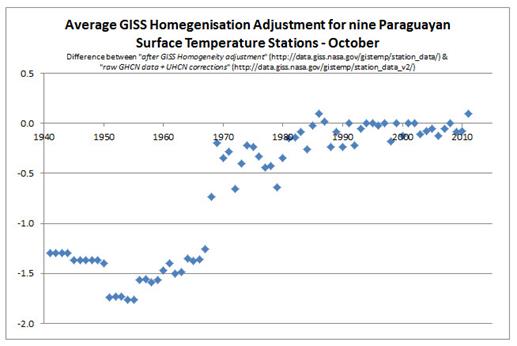
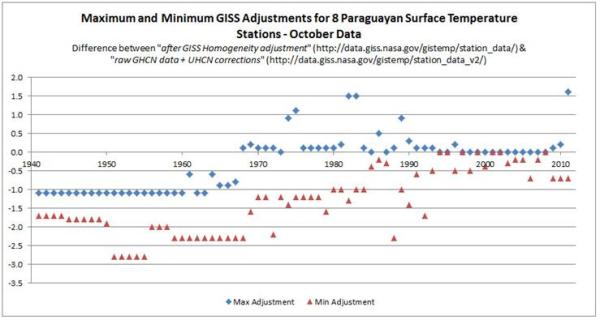
This pattern is broadly consistent across all data sets. These are the maximum and minimum adjustments.
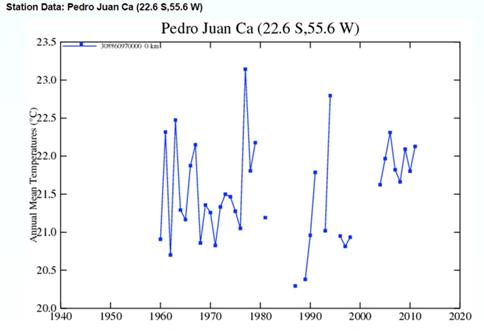
However, this issue is clouded by the special adjustments required for the Pedro Juan CA data set. The raw data set has been patched from four separate files,
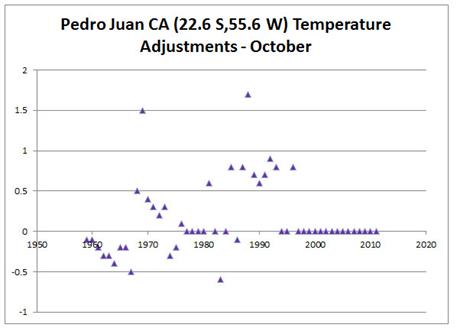
Removing does not affect the average picture.
But does affect the maximum and minimum adjustments. This is shows the consistency in the adjustment pattern.
The data sets are incomplete. Before 1941 there is only one data set – Ascuncion Aero. The count for October each year is as follows.
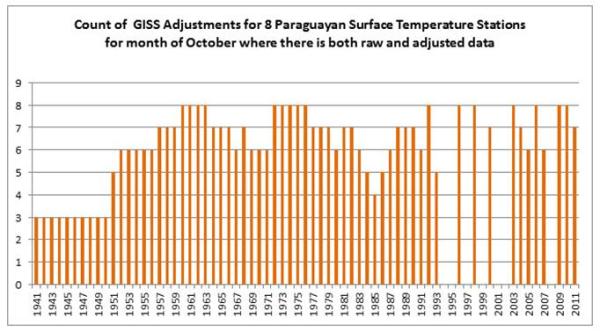
In recent years there are huge gaps in the data, but for the late 1960s when the massive switch in adjustments took place, there are six or seven pairs of raw and adjusted data.
Paul Homewood’s allegation that the past has been cooled is confirmed. However, it does not give a full understanding of the impact on the reported data. To assist, for the full year mean data, I have created temperature anomalies based on the average anomaly in that year.
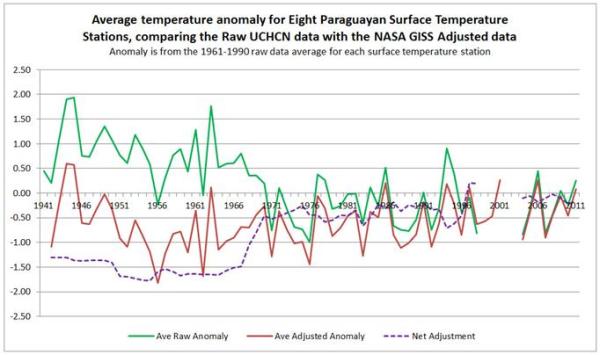
The raw data shows a significant cooling of up to 1oC in the late 1960s. If anything there has been over-compensation in the adjustments. Since 1970, any warming in the adjusted data has been through further adjustments.
Is this evidence of a conspiracy to “hide a decline” in Paraguayan temperatures? I think not. My alternative hypothesis is that this decline, consistent over a number of thermometers is unexpected. Anybody looking at just one of these data sets recently, would assume that the step change in 40-year-old data from a distant third world country is bound to be incorrect. (Shub has a valid point) That change goes against the known warming trend for over a century from the global temperature data sets and the near stationary temperatures from 1950-1975. More importantly cooling goes against the “known” major driver of temperature recent change – rises in greenhouse gas levels. Do you trust some likely ropey instrument data, or trust your accumulated knowledge of the world? The clear answer is that the instruments are wrong. Homogenisation is then not to local instruments in the surrounding areas, but to the established expert wisdom of the world. The consequent adjustment cools past temperatures by one degree. The twentieth century warming is enhanced as a consequence of not believing what the instruments are telling you. The problem is that this step change is replicated over a number of stations. Paul Homewood had shown that it probably extends into Bolivia as well.
But what happens if the converse happens? What if there is a step rise in some ropey data set from the 1970s and 1980s? This might be large, but not inconsitent with what is known about the world. It is unlikely to be adjusted downwards. So if there have been local or regional step changes in average temperature over time both up and down, the impact will be to increase the rate of warming if the data analysts believe that the world is warming and human beings are the cause of it.
Further analysis is required to determine the extent of the problem – but not from this unpaid blogger giving up my weekends and evenings.
Kevin Marshall
All first time comments are moderated. Please also use the comments as a point of contact, stating clearly that this is the case and I will not click the publish button, subject to it not being abusive. I welcome other points of view, though may give a robust answer.