Dixon and Jones confirm a result on the Stephan Lewandowsky Surveys

Congratulations to Ruth Dixon and Jonathan Jones on managing to get a commentary on the two Stephan Lewandowsky, Gilles Gignac & Klaus Oberauer surveys published in Psychological Science. Entitled “Conspiracist Ideation as a Predictor of Climate Science Rejection: An Alternative Analysis” it took two years to get published. Ruth Dixon gives a fuller description on her blog, My Garden Pond. It confirms something that I have stated independently, with the use of pivot tables instead of advanced statistical techniques. In April last year I compared the two surveys in a couple of posts – Conspiracist Ideation Falsified? (CIF) & Extreme Socialist-Environmentalist Ideation as Motivation for belief in “Climate Science” (ESEI).

The major conclusion through their analysis of the survey

All the data really shows is that people who have no opinion about one fairly technical matter (conspiracy theories) also have no opinion about another fairly technical matter (climate change). Complex models mask this obvious (and trivial) finding.

In CIF my summary was

A recent paper, based on an internet survey of American people, claimed that “conspiracist ideation, is associated with the rejection of all scientific propositions tested“. Analysis of the data reveals something quite different. Strong opinions with regard to conspiracy theories, whether for or against, suggest strong support for strongly-supported scientific hypotheses, and strong, but divided, opinions on climate science.

In the concluding comments I said

The results of the internet survey confirm something about people in the United States that I and many others have suspected – they are a substantial minority who love their conspiracy theories. For me, it seemed quite a reasonable hypothesis that these conspiracy lovers should be both suspicious of science and have a propensity to reject climate science. Analysis of the survey results has over-turned those views. Instead I propose something more mundane – that people with strong opinions in one area are very likely to have strong opinions in others. (Italics added)

Dixon and Jones have a far superior means of getting to the results. My method is to input the data into a table, find groupings or classifications, then analyse the results via pivot tables or graphs. This mostly leads up blind alleys, but can develop further ideas. For every graph or table in my posts, there can be a number of others stashed on my hard drive. To call it “trial and error” misses out the understanding to be gained from analysis. Their method (through rejecting linear OLS) is loess local regression. They derive the following plot.

This compares with my pivot table for the same data.

The shows in the Grand Total row that the strongest Climate (band 5) comprise 12% of the total responses. For the smallest group of beliefs about conspiracy theories with just 60/5005 responses, 27% had the strongest beliefs in about climate. The biggest percentage figure is the group who averaged a middle “3” score on both climate and conspiracy theories. That is those with no opinion on either subject.

The more fundamental area that I found is that in the blog survey between strong beliefs in climate science and extreme left-environmentalist political views. It is a separate topic, and its inclusion by Dixon and Jones would have both left much less space for the above insight in 1,000 words, and been much more difficult to publish. The survey data is clear.

The blog survey (which was held on strongly alarmist blogs) shows that most of the responses were highly skewed to anti-free market views (that is lower response score) along with being strongly pro-climate.

The internet survey of the US population allowed 5 responses instead of 4. The fifth was a neutral. This shows a more normal distribution of political beliefs, with over half of the responses in the middle ground.

This shows what many sceptics have long suspected, but I resisted. Belief in “climate science” is driven by leftish world views. Stephan Lewandowsky can only see the link between the “climate denial” beliefs and free-market, because he views left-environmentalist perspectives and “climate science” as a priori truths. This is the reality that everything is to be measured. From this perspective climate science has not failed due to being falsified by the evidence, but because scientists have yet to find the evidence; the models need refining; and there is a motivated PR campaign to undermine these efforts.

Kevin Marshall


The Propaganda methods of ….and Then There’s Physics on Temperature Homogenisation

There has been a rash of blog articles about temperature homogenisations that is challenging the credibility of the NASS GISS temperature data. This has lead to attempts by anonymous blogger andthentheresphysics (ATTP) to crudely deflect from the issues identified. It is propagandist’s trick of turning people’s perspectives. Instead of a dispute about some scientific data, ATTP turns the affair into a dispute between those with authority and expertise in scientific analysis, against a few crackpot conspiracy theorists.

The issues on temperature homogenisation are to do with the raw surface temperature data and the adjustments made to remove anomalies or biases within the data. “Homogenisation” is a term used for process of adjusting the anomalous data into line with that from the surrounding data.

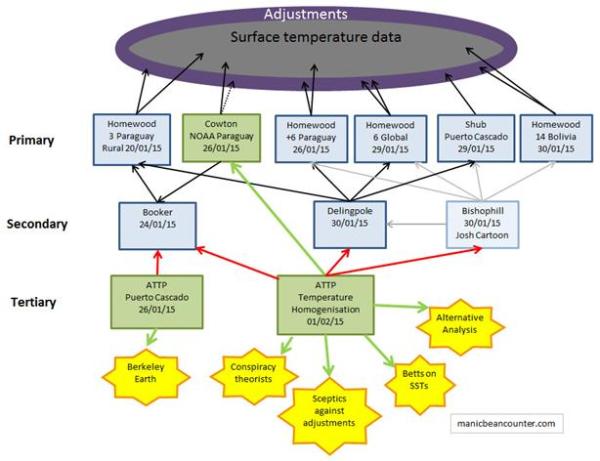
The blog articles can be split into three categories. The primary articles are those that make direct reference to the raw data set and the surrounding adjustments. The secondary articles refer to the primary articles, and comment upon them. The tertiary articles are directed at the secondary articles, making little or no reference to the primary articles. I perceive the two ATTP articles as fitting into the scheme below.

Primary Articles

The source of complaints about temperature homogenisations is Paul Homewood at his blog notalotofpeopleknowthat. The source of the articles is NASA’s Goddard Institute for Space Studies (GISS) database. For any weather station GISS provide nice graphs of the temperature data. The current after GISS homogeneity adjustment data is available here and the raw GHCN data + UHSHCN corrections is available here up until 2011 only. For any weather station GISS provide nice graphs of the temperature data. Homewood’s primary analysis was to show the “raw data” side by side.

20/01/15 Massive Tampering With Temperatures In South America

This looked at all three available rural stations in Paraguay. The data from all three at Puerto Casado, Mariscal and San Jan Buatista/Misiones had the same pattern of homogenization adjustments. That is, cooling of the past, so that instead of the raw data showing the 1960s being warmer than today, it was cooler. What could they have been homogenized to?

26/01/15 All Of Paraguay’s Temperature Record Has Been Tampered With

This checked the six available urban sites in Paraguay. Homewood’s conclusion was that

warming adjustments have taken place at every single, currently operational site in Paraguay.

How can homogenization adjustments all go so same way? There is no valid reason for making such adjustments, as there is no reference point for the adjustments.

29/01/15Temperature Adjustments Around The World

Homewood details other examples from Southern Greenland, Iceland, Northern Russia, California, Central Australia and South-West Ireland. Instead of comparing the raw with the adjusted data, he compared the old adjusted data with the recent data. Adjustment decisions are changing over time, making the adjusted data sets give even more pronounced warming trends.

30/01/15 Cooling The Past In Bolivia

Then he looked at all 14 available stations in neighbouring Bolivia. His conclusion

At every station, bar one, we find the ….. past is cooled and the present warmed.”

(The exception was La Paz, where the cooling trend in the raw data had been reduced.)

Why choose Paraguay in the first place? In the first post, Homewood explains that within a NOAA temperature map for the period 1981-2010 there appeared to be a warming hotspot around Paraguay. Being a former accountant he checked the underlying data to see if it existed in the data. Finding an anomaly in one area, he checked more widely.

The other primary articles are

26/01/15 Kevin Cowton NOAA Paraguay Data

This Youtube video was made in response to Christopher Booker’s article in the Telegraph, a secondary source of data. Cowton assumes Booker is the primary source, and is criticizing NOAA data. A screen shot of the first paragraph shows these are untrue.

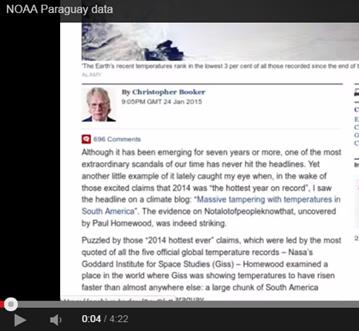
Further, if you read down the article, Cowton’s highlighting of the data from one weather station is also misleading. Booker points to three, but just illustrates one.

Despite this, it still ranks as a primary source, as there are direct references to the temperature data and the adjustments. They are not GISS adjustments, but might be the same.

29/01/15 Shub Niggurath – The Puerto Casado Story

Shub looked at the station moves. He found that the metadata for the station data is a mess, so there is no actual evidence of the location changing. But, Shub reasons the fact that there was a step change in the data meant that it moved, and the fact that it moved meant there was a change. Shub is a primary source as he looks at the adjustment reason.


Secondary Articles

The three secondary articles by Christopher Booker, James Delingpole and BishopHill are just the connectors in this story.


Tertiary articles of “…and Then There’s Physics”

25/01/15 Puerto Cascado

This looked solely at Booker’s article. It starts

Christopher Booker has a new article in the The Telegraph called Climategate, the sequel: How we are STILL being tricked with flawed data on global warming. The title alone should be enough to convince anyone sensible that it isn’t really worth reading. I, however, not being sensible, read it and then called Booker an idiot on Twitter. It was suggested that rather than insulting him, I should show where he was wrong. Okay, this isn’t really right, as there’s only so much time and effort available, and it isn’t really worth spending it rebutting Booker’s nonsense.

However, thanks to a tweet from Ed Hawkins, it turns out that it is really easy to do. Booker shows data from a site in Paraguay (Puerto Casado) in which the data was adjusted from a trend of -1.37o C per century to +1.36o C per century. Shock, horror, a conspiracy?


ATTP is highlighting an article, but is strongly discouraging anybody from reading it. That is why the referral is a red line in the graphic above. He then says he is not going to provide a rebuttal. ATTP is good to his word and does not provide a rebuttal. Basically it is saying “Don’t look at that rubbish, look at the real authority“. But he is wrong for a number of reasons.

  1. ATTP provides misdirection to an alternative data source. Booker quite clearly states that the source of the data is the NASA GISS temperature set. ATTP cites Berkeley Earth.
  2. Booker clearly states that there are thee rural temperature stations spatially spread that show similar results. ATTP’s argument that a single site was homogenized with the others in the vicinity falls over.
  3. This was further undermined by Paul Homewood’s posting on the same day on the other 6 available sites in Paraguay, all giving similar adjustments.
  4. It was further undermined by Paul Homewood’s posting on 30th January on all 14 sites in Bolivia.

The story is not of a wizened old hack making some extremist claims without any foundation, but of a retired accountant seeing an anomaly, and exploring it. In audit, if there is an issue then you keep exploring it until you can bottom it out. Paul Homewood has found an issue, found it is extensive, but is still far from finding the full extent or depth. ATTP, when confronted by my summary of the 23 stations that corroborate each other chose to delete it. He has now issued an update.

Update 4/2/2015 : It’s come to my attention that some are claiming that this post is misleading my readers. I’m not quite sure why, but it appears to be related to me not having given proper credit for the information that Christopher Booker used in his article. I had thought that linking to his article would allow people to establish that for themselves, but – just to be clear – the idiotic, conspiracy-laden, nonsense originates from someone called Paul Homewood, and not from Chistopher Booker himself. Okay, everyone happy now? J

ATTP cannot accept that he is wrong. He has totally misrepresented the arguments. When confronted with alternative evidence ATTP resorts to vitriolic claims. If someone is on the side of truth and science, they will encourage people to compare and contrast the evidence. He seems to have forgotten the advice about when in a whole…..

01/02/15
Temperature homogenisation

ATTP’s article on Temperature Homogenisation starts

Amazing as it may seem, the whole tampering with temperature data conspiracy has managed to rear its ugly head once again. James Delingpole has a rather silly article that even Bishop Hill calls interesting (although, to be fair, I have a suspicion that in “skeptic” land, interesting sometimes means “I know this is complete bollocks, but I can’t bring myself to actually say so”). All of Delingpole’s evidence seems to come from “skeptic” bloggers, whose lack of understand of climate science seems – in my experience – to be only surpassed by their lack of understanding of the concept of censorship J.

ATPP starts with a presumption of being on the side of truth, with no fault possible on his side. Any objections are due to a conscious effort to deceive. The theory of cock-up or of people not checking their data does not seem to have occurred to him. Then there is a link to Delingpole’s secondary article, but calling it “silly” again deters readers from looking for themselves. If they did, the readers would be presented with flashing images of all the “before” and “after” GISS graphs from Paraguay, along with links to the 6 global sites and Shub’s claims that there is a lack of evidence for the Puerto Casado site being moved. Delingpole was not able the more recent evidence from Bolivia, that further corroborates the story.

He then makes a tangential reference to his deleting my previous comments, though I never once used the term “censorship”, nor did I tag the article “climate censorship”, as I have done to some others. Like on basic physics, ATTP claims to have a superior understanding of censorship.

There are then some misdirects.

  • The long explanation of temperature homogenisation makes some good points. But what it does not do is explain that the size and direction of any adjustment is an opinion, and as such be wrong. It a misdirection to say that the secondary sources are against any adjustments. They are against adjustments that create biases within the data.
  • Quoting Richard Betts’s comment on Booker’s article about negative adjustments in sea temperature data is a misdirection, as Booker (a secondary source) was talking about Paraguay, a land-locked country.
  • Referring to Cowton’s alternative analysis is another misdirect, as pointed out above. Upon reflection, ATTP may find it a tad embarrassing to have this as his major source of authority.

Conclusions

When I studied economics, many lecturers said that if you want to properly understand an argument or debate you need to look at the primary sources, and then compare and contrast the arguments. Although the secondary sources were useful background, particularly in a contentious issue, it is the primary sources on all sides that enable a rounded understanding. Personally, by being challenged by viewpoints that I disagreed with enhanced my overall understanding of the subject.

ATTP has managed to turn this on its head. He uses methods akin to crudest propagandists of last century. They started from deeply prejudiced positions; attacked an opponent’s integrity and intelligence; and then deflected away to what they wanted to say. There never gave the slightest hint that one side might be at fault, or any acknowledgement that the other may have a valid point. For ATTP, and similar modern propagandists, rather than have a debate about the quality of evidence and science, it becomes a war of words between “deniers“, “idiots” and “conspiracy theorists” against the basic physics and the overwhelming evidence that supports that science.

If there is any substance to these allegations concerning temperature adjustments, for any dogmatists like ATTP, it becomes a severe challenge to their view of the world. If temperature records have systematic adjustment biases then climate science loses its’ grip on reality. The climate models cease to be about understanding the real world, but conforming to people’s flawed opinions about the world.

The only way to properly understand the allegations is to examine the evidence. That is to look at the data behind the graphs Homewood presents. I have now done that for the nine Paraguayan weather stations. The story behind that will have to await another day. However, although I find Paul Homewood’s claims of systematic biases in the homogenisation process to be substantiated, I do not believe that it points to a conspiracy (in terms of a conscious and co-ordinated attempt to deceive) on the part of climate researchers.

Conspiracist Ideation Falsified?

Summary

A recent paper, based on an internet survey of American people, claimed that “conspiracist ideation, is associated with the rejection of all scientific propositions tested“. Analysis of the data reveals something quite different. Strong opinions with regard to conspiracy theories, whether for or against, suggest strong support for strongly-supported scientific hypotheses, and strong, but divided, opinions on climate science.

Preamble

In 2012 I spent a lot of time looking at a paper “Lewandowsky, Oberauer & Gignac – NASA faked the moon landing:Therefore (Climate) Science is a Hoax: An Anatomy of the Motivated Rejection of Science” – hereafter called LOG12. The follow up in early 2013 was the notorious Recursive Fury paper that has now been withdrawn (Here and here). When a new paper came out, by the same authors reaching pretty much the same conclusions, I had lost interest.

However, Barry Woods, a victim of the Recursive Fury paper, suggested in a comment:-

Lewandowsky always claimed that his US study replicated LOG12

Could you try the same pivot table analysis as LOG12?

I had a quick look at the file, tried a few pivot tables, had a short email exchange, and found something interesting.

The 2013 US study is “The Role of Conspiracist Ideation and Worldviews in Predicting Rejection of Science” – Stephan Lewandowsky, Gilles E. Gignac, Klaus Oberauer. PLOS one. Hereafter called LOG13.

The two papers were similar in that

  • The three authors were the same.
  • Many of the questions were the same, or very similar.
  • The conclusions were similar.

The two papers are different in that

  • LOG12 was an internet survey, conducted solely through “pro-science” blogs. LOG13 was another internet survey, but this time of the U.S. population.
  • LOG12 had just 4 responses. Running 1 to 4 they are strongly/weakly reject and weakly strongly accept. LOG13 had 5 responses. In the middle there was a neutral/don’t know/no opinion option.

At “Shaping Tommorow’s World” Blog, Lewandowsky and Oberauer said of the LOG13 paper:-

Conclusions: Free-market worldviews are an important predictor of the rejection of scientific findings that have potential regulatory implications, such as climate science, but not necessarily of other scientific issues. Conspiracist ideation, by contrast, is associated with the rejection of all scientific propositions tested.

It is the last part that I will deal with in this posting. Free market views I may come back to at a later time.


Comparison of conspiracist orientations and science denial in LOG12 (pro-science blogs) and LOG13 (Americans)

LOG12 had thirteen questions on conspiracy theories and LOG13 nine. In the latter three were on science issues and one on “New World Order”. That left five that are comparable between the papers, but independent of the scientific / political subject matter1.

In LOG12 there were two scientific questions. In short they are “HIV causes AIDS” and “smoking causes lung cancer”. In LOG13 was added “lead in drinking water harms health”

This can be compared by banding the belief in conspiracy theories by the rounded average response.


The first column in the table is the band, taken by rounding the average response to the nearest whole number for the responses to the 5 conspiracy theories. The second column is the unrounded average response within the band. The third column is the number of responses. The fourth column is the average response to the two science questions. The fifth column is acceptance ratio.

For the LOG12 survey, conducted via “pro-climate science” blogs, the connection is clear. The belief in the five conspiracy theories is inversely related to belief in two well-accepted scientific hypotheses. However, there is strong acceptance of the two science questions by all but two respondents. The two respondents who were in the highest conspiracy category I referred to as “rogue responses” in my earlier analysis, and which Steve McIntyre called “super-scammers”. Take out the two scam responses and there is a picture of degrees of science acceptance and no science denial.


For the LOG13, an internet survey of the American public, there is a somewhat different picture. The belief in three well-accepted scientific hypotheses appears to be related to the strength of opinion for three conspiracy theories, independent of the direction of that opinion. The respondents with the least belief in the scientific hypotheses are those who are in the middle on conspiracy theories. That is those who express no opinion, or give similar weight to both sides. Yet they still are, on average, affirming of the scientific consensus. There is no “rejection of the science” at all by any band of belief in conspiracy theories. Further, the greatest “believers in science” are the 12 who have the greatest “conspiracist” ideation. Like the authors, I have no truck with conspiracy theories. But the evidence does not support the statement “conspiracist ideation, … is associated with the rejection of all scientific propositions tested“. Falsely maligning a group of people will only serve to confirm them in their beliefs.


Comparison of conspiracist orientations and climate science denial in LOG12 (pro-science blogs) and LOG13 (Americans)

A similar comparison can be made between the beliefs in conspiracy theories and the beliefs in climate science.


In LOG12 there appears to be a relationship. 97% of respondents strongly accept climate science and reject conspiracy theories. The 30 who have a modest acceptance of conspiracy theories are a little more lukewarm on climate science. The real odd result are the two scam responses.


In LOG13 there is a distinct relationship here – the stronger the belief in conspiracy theories, the lower the belief in climate science. But hold on. A score of 3 is neutral, and 5 is total acceptance. The difference is between very lukewarm acceptance and virtually no opinion either way. To claim rejection is misleading. However, the result appears to contradict the previous result the three scientific hypotheses. To understand this result needs closer examination. There were 5 statements and 1001 responses, so 5005 total responses in total. Counting all the responses gives the following result4


To clarify, the “Grand Total” row shows that there were 366 scores of 1 in the 5 CO2 science statements. Of these 15 were by the 12 respondents who averaged a score of 5 in the conspiracy theories. The proportions I believe can be better seen by the percentage of responses in each row.


So 7% of all the 5005 responses were a score of 1. Of the 60 responses by the strongest believers in conspiracy theories, 25% were score of 1.

We get a similar result for belief climate science to belief in three well-accepted scientific hypotheses. Those with the most extreme opinions on conspiracy theories are those with the most extreme opinions on climate change. But there is a crucial difference, in that opinions on climate change are split between acceptance and rejection. The 12 respondents, who were the strongest believers in conspiracy theories, also had the highest proportion of 1s and 5s on the climate questions. The second most extreme group was the 215 respondents on the strong rejection group. The highest proportion of 3s, along with the lowest proportions of 1s and 5s were those in middle band on conspiracy theories. Holding strong opinions on conspiracy theories seems to be a predictor of strong opinions on climate science, but not a predictor of whether that is strong belief or strong rejection.

Corroboration of the result

The results of the internet survey confirm something about people in the United States that I and many others have suspected – they are a substantial minority who love their conspiracy theories. For me, it seemed quite a reasonable hypothesis that these conspiracy lovers should be both suspicious of science and have a propensity to reject climate science. Analysis of the survey results has over-turned those views. Instead I propose something more mundane – that people with strong opinions in one area are very likely to have strong opinions in others.

In relation to the United States, there is a paradox if you follow the “conspiracist ideation”. Along with being a hotbed of conspiracy theorists, the US is also home to 11 or 15 of the World’s top universities and much of the technological revolutions of the past 50 years originate. If science is about conformity and belief in the established expert opinion, this could not have happened.

Kevin Marshall


Notes

  1. Five, non-science, conspiracy theories, in common to LOG12 and LOG13
  • CYMLK The assassination of Martin Luther King Jr. was the result of an organized conspiracy by U.S. government agencies such as the CIA and FBI.
  • CYMoon The Apollo moon landings never happened and were staged in a Hollywood film studio.
  • CYJFK The assassination of John F. Kennedy was not committed by the lone gunman Lee Harvey Oswald but was rather a detailed organized conspiracy to kill the President.
  • CY911 The U.S. government allowed the 9–11 attacks to take place so that it would have an excuse to achieve foreign (e.g., wars in Afghanistan and Iraq) and domestic (e.g., attacks on civil liberties) goals that had been determined prior to the attacks.
  • CYDiana Princess Diana’s death was not an accident but rather an organised assassination by members of the British royal family who disliked her.


  1. Acceptance Ratio

    Comparing the average scores across the two surveys can be confusing where there are a different number of options. The acceptance ratio makes average scores comparable where there are a large number of responses. Strong acceptance scores 1, strong rejection -1 and the mid-point 0.


  2. Climate Science

LOG 12 had four questions on Climate science

CO2TempUp I believe that burning fossil fuels increases atmospheric temperature to some measurable degree

CO2AtmosUp I believe that the burning of fossil fuels on the scale observed over the last 50 years has increased atmospheric temperature to an appreciable degree

CO2WillNegChange I believe that the burning of fossil fuels on the scale observed over the last 50 years will cause serious negative changes to the planet’s climate, unless there is a substantial switch to non-CO2 emitting energy sources

CO2HasNegChange I believe that the burning of fossil fuels on the scale observed over the last 50 years has caused serious negative changes to the planet’s climate

LOG 13 had five questions on Climate science

CNatFluct I believe that the climate is always changing and what we are currently observing is just natural fluctuation. (R)

CdueGHG I believe that most of the warming over the last 50 years is due to the increase in greenhouse gas concentrations.

CseriousDamage I believe that the burning of fossil fuels over the last 50 years has caused serious damage to the planet’s climate.

CO2causesCC Human CO2 emissions cause climate change.

HumansInsign Humans are too insignificant to have an appreciable impact on global temperature. (R)

  1. Response Count

To replicate my response table, create a pivot table for count of responses for each of the climate change statements. Make the conspiracy bands the row labels, and a climate statement as the column label. Add the results together.


Lewandowsky’s false inference from an absurd correlation

Steve McIntyre has posted a number of instances where Stephan Lewandowsky has reported correlations for which there is little or no evidence. My comment is

Even more bizarre than absurd correlations, is to draw inferences of cause and effect from correlations, when there are a huge number of equally valid (or invalid) inferences that can be made.

The title of the Hoax paper is “NASA faked the moon landing|Therefore (Climate) Science is a Hoax: An Anatomy of the Motivated Rejection of Science“. The first part implies that, due to coming to believe that the moon landing was faked, survey respondents reasoned that climate science was also a hoax. But, given that this survey was only on climate blogs, is it not more likely that the respondent’s rejection of “official” or orthodox version of events goes the other way?

Looking at the data there is a similar issue of low numbers on support of the paired statements. Only 10/1145 supported CYMoon. Of these only 3 supported CYClimChange. Of these only 2 scored “4” for both. And these were the two faked/scam/rogue respondents 860 & 889 whose support of every conspiracy theory underpinned many of the correlations. The third, 963, also supported every conspiracy theory. Let us assume that they are genuine believers in all the conspiracy theories. Further, let us assume that one of the 13 conspiracies in the survey did trigger a response of the form “because I now know A was a conspiracy, I now believe B is a conspiracy”. There are 2n(n-1)= 312 possible versions of this statement. Or, more likely, no such reasoning process went through any respondent’s mind at all. Given the question was never asked, and there is no supporting evidence for the statement “NASA faked the moon landing|Therefore (Climate) Science is a Hoax” it most likely a figment of someone’s imagination.

Data in support of this statement

In the survey the answer 1 was a strong rejection, 4 a strong support. Out of 1145 responses, only 6 strongly supported the “NASA faked the Moon Landing” hypothesis, and a further 4 lent support to it. Of these 10, only 3 support the “Climate Change is a Hoax” statement.

The strong support for conspiracy theories is shown by giving the average score of respondents over all 13 conspiracy questions. The 3 that supported by CYMoon and CYClimChange had the highest average scores of all 1145 respondents.