In my previous post I noted how some Labour MPs were falsely claiming that the Boundary Commission’s recommendations for England and Wales were party-political gerrymandering. Labour Party Leader, the Rt Hon Jeremy Corbyn MP makes a quite different claim to some of his more desperate MPs.
Corbyn claims that since last December (which the Boundary Commission used as a basis of the boundary changes) the electorate has grown by two million people. That is nearly 5% of the electorate. As a result of the wrong figures “you cannot deliver a fair and democratic result on the basis of information that is a year out of date. “
Actually it is possible for it to be fair and democratic if the growth in the electorate is evenly spread across the country. That should be a default position that Corbyn needs to disprove. The question is, how much would the imbalance have to be to wipe out the disadvantage Labour gets from the boundary review – a disadvantage due to current 231 Labour seats in England and Wales having on average 3515 fewer constituents than the 329 Conservative seats in May 2015. Let us do the maths, ignoring the 13 seats held by other parties and the Speaker. To even up average constituency size Labour constituencies would need about 812,000 extra voters (231 x 3515), and for the rest of the two million to be evenly spread between the other 560 constituencies. That is about 2120 extra voters. It is not impossible that the average Labour constituency has added 5635 to the electoral roll (>8% extra) and the average Conservative constituency has added 2120 to the electoral roll (<3% extra). Winning the millions on Lotto is not impossible either. But both are highly unlikely, as the reason for the Boundary Review is that Constituency sizes have diverged, with greater growth in the South of England than in the North of England and Wales. So like other Labour MPs, Jeremy Corbyns’ opposition to the Boundary Commission’s proposals seem to be opposition to greater equality and fairness in the British democratic processes.
Two graphs to illustrate this point. Figure 1 from the previous post shows the average constituency size by party and region.
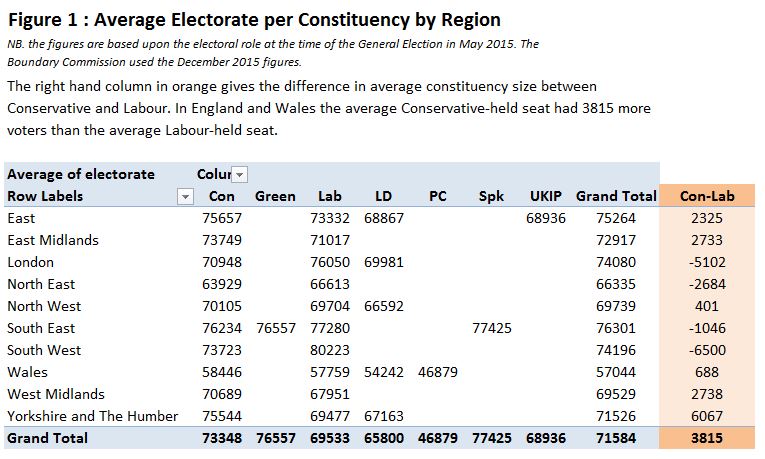
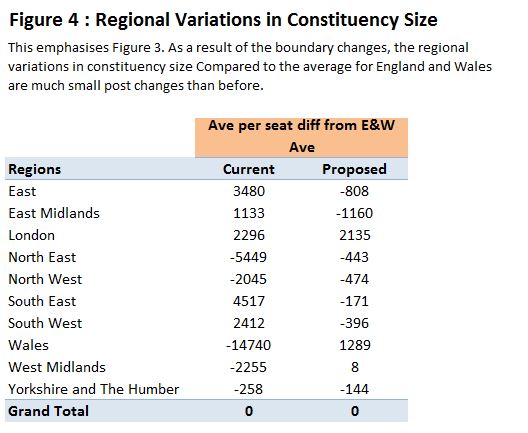
Figure 4 from the previous post shows that average constituency size per region is made much closer to the average constituency size for England and Wales in the proposed changes.