Climateaudit reports
Kaufman and the PAGES2K Arctic2K group recently published a series of major corrections to their database, some of which directly respond to Climate Audit criticism. The resulting reconstruction has been substantially revised with substantially increased medieval warmth. His correction of the contaminated Igaliku series is unfortunately incomplete and other defects remain.
This post is on comparing the revised reconstruction with other data. In the comments Jean S provides a graph that compares the revised graph in red with the previous version in black. I have added some comparative time periods.
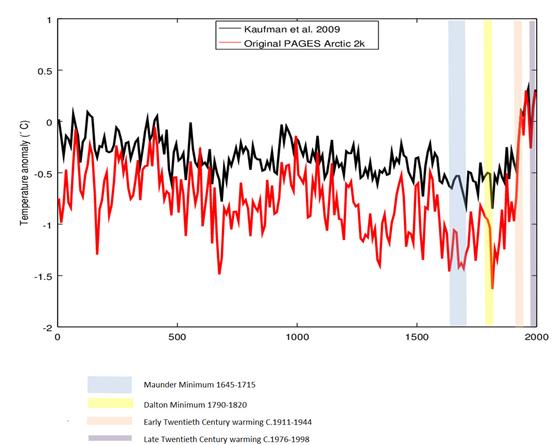
- The Maunder minimum of 1645-1715 corresponds to a very cold period in the Arctic. The end of the minimum was associated with a rebound in temperatures.
- The Dalton minimum of 1790-1820 corresponds to a period of sharply declining temperatures, with the end of the period being the coldest in 2,000 years. The end of the minimum was associated with a rebound in temperatures.
- The early twentieth century shows about 1.1oC of warming from trough to peak in a time period that corresponds to the 1911-1944 trough-to-peak warming of the global temperature series. It is about twice the size of that calculated globally by HADCRUT4 and GISTEMPa, consistent with there being greater fluctuations in average temperatures at the poles than in the tropics.
- The late twentieth century shows about 0.5oC of warming from trough to peak in a time period that corresponds to the 1976-1998 trough-to-peak warming of the global temperature series. This is broadly in line with that calculated globally by HADCRUT4 and GISTEMPa. This possibly corroborates data of individual weather stations having a warming adjustment bias (e.g. Reykjavik and Rutherglen) along with the national data sets of USA (Steve Goddard) and Australia (Jennifer Marohasy and Joanne Nova). Most of all, Paul Homewood has documented adjustment biases in the Arctic data sets.
- The proxy data shows a drop in average temperatures from the 1950s to 1970s. The late twentieth century warming appears to be a mirrored rebound of this cooling. Could the measured reductions in Arctic sea ice cover since 1979 partly be due to a similar rebound?
In conclusion, the Pages2K Arctic reconstruction raises some interesting questions, whilst corroborating some things we already know. It demonstrates the utility of these temperature reconstructions. As Steve McIntyre notes, the improvements partly came about through recognizing the issues in the past data set. Hopefully the work will continue, along with trying to collect new proxy data and refine existing techniques of analysis.
UPDATE 23.00
In the above, it is evident that the early twentieth century (c.1911-1944) Arctic warming in the revised reconstruction was twice the size of late twentieth century (c.1976-1978) warming, when global temperature anomalies show the later period as being greater in size. Steve McIntyre’s latest post shows that at least part of the answer may lie in the inclusion of the Okshola, Norway speleothem O18 and Renland, Greenland O18 series. These proxies both show a downturn at the end of the twentieth century. This might conceivably be a much greater influence on the discrepancy than either adjustment biases in temperature data, or differences between actual, not fully known, temperature anomalies between the Arctic region and the World. However, we will get a better understanding by eliminating the obvious outliers in the proxies and by continuing to positively seeking to eliminate bias in the global surface temperature anomalies.
Kevin Marshall
Notes
-
Earlier this year I calculated the early twentieth century warming rates for the HADCRUT and GISTEMP series. They are
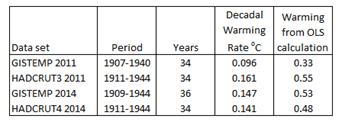
-
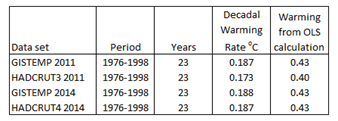
From the same posting the 1976-1998 warming rates are

Steve McIntyre
/ 04/10/2014You’ve picked up the wrong graphic. This compares the earlier PAGES 2K version to Kaufman et al 2009. It doesn’t show the present PAGES2K version, which has not yet been released digitally, but is shown in a different CA graphic.