Last year in “Aerosols – The UNIPCC AR4 adjustment factor” I claimed that in 2007 the UNIPCC engineered the radiative forcing components to tell a story. It basically manipulated the figures to account for the lack of warming up to that point. The release of AR5 Working Group 1 report yesterday shows the extent of the false levels of certainty in the scientist’s estimates in 2007.
The Data
In 2007 Figure 2.4 of the Synthesis Report was as follows

In 2013, Figure SPM.5 is below1
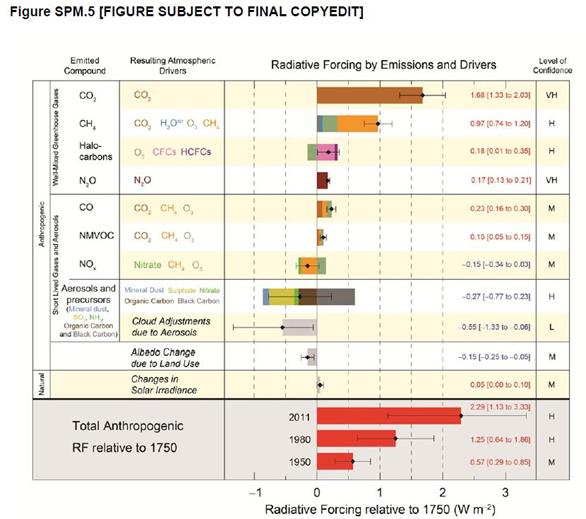
There are slight changes in format and terminology. I have put the two tables side-by-side for comparison, with analysis:-
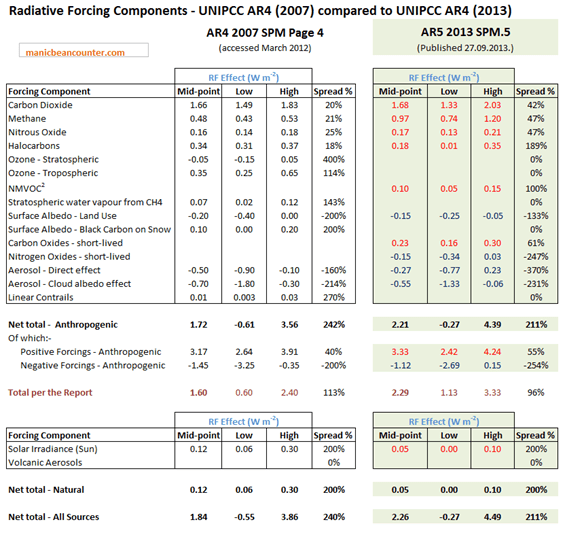
The range of forcings I have expressed the range as a percentage of the mid-point.
Below are comments on the individual forcing components.
Carbon Dioxide CO2
The most important anthropogenic greenhouse gas has hardly moved, from 1.66 to 1.68 W m-2. In 1750 CO2 levels were 280 ppm, rising to 379 ppm in 2005 and 392 ppm in 2011. In 2007, the scientists estimated that it took a rise of 60 ppm to increase radiative forcing by 1 W m-2, compared to 66 ppm in 2013. Scientists have found that CO2 is 10% less effective as a greenhouse gas than previously thought. They are far less certain about this figure, as the range has doubled, but they are still have high confidence in their figures4 but scientists have switched from high confidence to very high confidence with their figures.3
Methane CH4
CH4 has practically doubled in impact, from 0.48 to 0.97 W m-2. In 1750 CH4 levels were 715 ppb, rising to 1774 ppb in 2005 and 1803 ppb in 2011. In 2007, the scientists estimated that it took a rise of 2200 ppb to increase radiative forcing by 1 W m-2, compared to 1120 ppm in 2013. Scientists have found that CH4 was practically twice as potent as a greenhouse gas than previously thought. They are far less certain about this figure, as the range has more than doubled relative to the mid-point. More significantly, the new potency is well outside the confidence range of the 2007 report. There the high point of the uncertainty range was 0.53 W m-2, whereas the low point of the uncertainty range is 0.74 W m-2. Despite having been so far out six years ago the scientists still have high confidence in their figures. The reason given on page 9 is
This difference in estimates is caused by concentration changes in ozone and stratospheric water vapour due to CH4 emissions and other emissions indirectly affecting CH4.
The potency of CH4 is a modelled estimate based on other factors. It is by including these indirect effects that the uncertainty is increased.
As a side point, of the 1100 ppb rise in CH4 levels since 1750, 80% was prior to the 1975. It has ceased to be a significant contributor to increasing radiative forcing. Given the increased recognised potency, it is a minor explanation of the pause in warming.
Nitrous Oxide N2O
This has hardly moved in impact, from 0.16 to 0.17 W m-2. In 1750 N2O levels were 270 ppb, rising to 319 ppb in 2005 and 324 ppb in 2011. Scientists are far less certain about these figures, as the range has nearly doubled, but they still have high confidence in their figures.
Halocarbons4
Although a minor group of greenhouse gases the impact has reduced from 0.34 to 0.18 W m-2, but the magnitude to the uncertainty band has increased more than five-fold from 0.06 (0.37-0.31) to 0.34 (0.35-0.01). Instead of reducing scientists confidence, they have gone from “high confidence” to “very high confidence” in the figures.
Aerosols
Of the 2007 report I claimed they were a fudge factor, suppressing the warming effect of greenhouse gases. The combined mid-point is now 1.20 W m-2of direct and cloud albedo effects, down more than 30% on 2007. The range of uncertainty is more significant. This has increased from 0.8 to 0.9 W m-2, with the impact of the high-end being a net warming effect. Despite being now being uncertain of whether the direct effect of aerosols warm or cool the planet, and despite being less certain of already high “confidence” range six years ago, the scientists still have high confidence in their figures.
Forecasts for Radiative Forcing in 2100 for CO2 and CH4
Let us assume that CO2 continue to increase at 3ppm a year and CH4 increases by 5ppb a year until 2100. Using 2007 potency estimates, CO2 forcing will be 6.34 W m-2 and CH4 will be 0.69 W m-2 above 1750 levels. Using 2013 potency estimates, CO2 forcing will be 5.72 W m-2 and CH4 will be 1.37 W m-2 above 1750 levels. Combined estimated forcing is less than 1% different, despite doubling the potency of CH4. Maybe we will have a much greater reason to worry about the melting of permafrost in the tundra, causing a huge rise in atmospheric methane levels. Suppressed warming from this factor has been doubled.
Conclusion
Scientists now implicitly admit that they were much too confident about the potency of greenhouse gases in 2007. They have now doubled the uncertainty bands on the three major greenhouse gases. Yet recognizing this past over confidence seems to have had no impact on current levels of confidence.
Kevin Marshall
Notes
- The graphic at the time of writing was only available in pdf format.
- NMVOC = Non-methane volatile organic compounds. They have a role in the production of ozone. Defra have a fuller explanation.
- All these figures are available from the 2007 “Full report” page and the 2013 WG1 Summary for Policymakers page 7. This is the 27-09-13 version. Page numbering will change once tables are properly inserted.
- Upon re-reading I have made two adjustments. For CO2, I note that scientists have increased their confidence despite doubling the size of their uncertainty bands. I have also added a comment on halocarbons, where confidence has increased, despite a
