Last week the BBC News headlined Brexit deal means ‘£70bn hit to UK by 2029′. ITV news had a similar report. The source, NIESR, summarizes their findings as follows:-
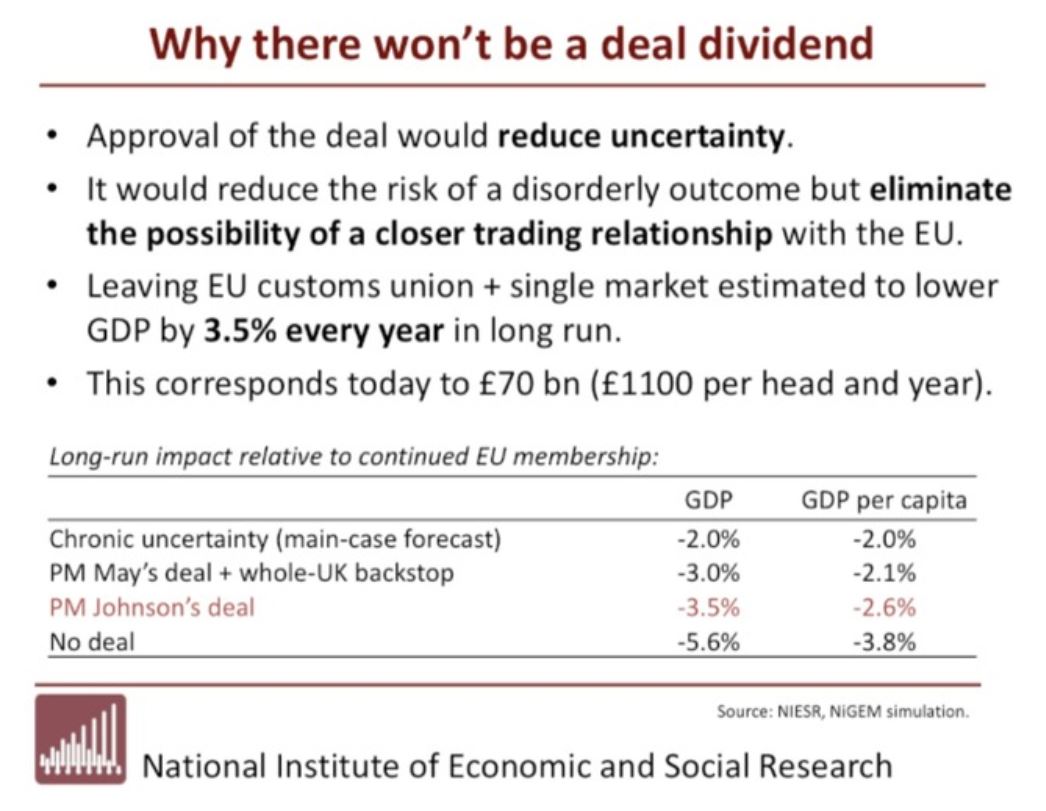
Fig 1 : NIESR headline findings
£70bn appears to be a lot of money, but this is a 10 year forecast on an economy that currently has a GDP of £2,000bn. The difference is about one third of one percent a year. The “no deal” scenario is just £40bn worse than the current deal on offer, hardly an apocalyptic scenario that should not be countenanced. Put another way, if underlying economic growth is 2%, from the NIESR in ten years the economy will be between 16% and 22% larger. In economic forecasting, the longer the time frame, the more significant the underlying assumptions. The reports are based on an NIESR open-access paper Prospects for the UK Economy – Arno Hantzsche, Garry Young, first published 29 Oct 2019. The key basis is contained in Figures 1 & 2, reproduced below.
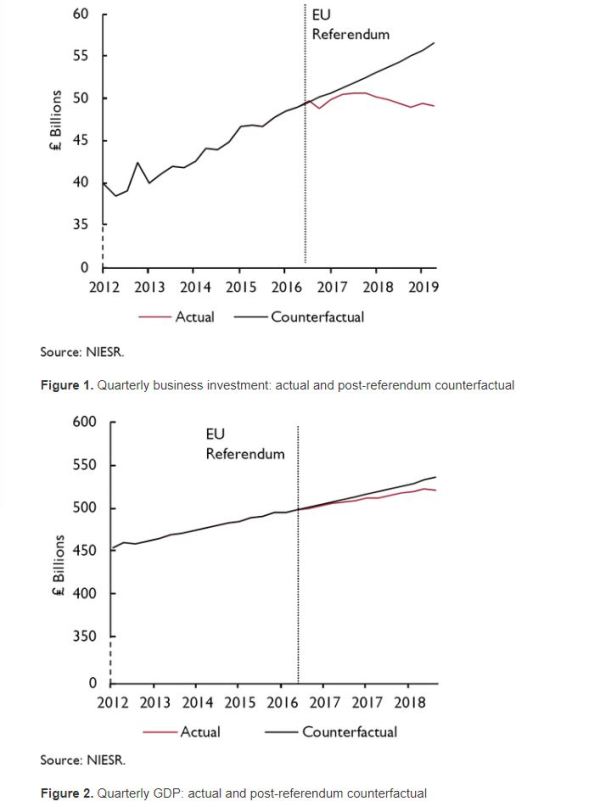 Fig 2 : Figures 1 & 2 from the NIESR paper “Prospects for the UK Economy“
The two key figures purport to show that Brexit has made a difference. Business investment growth has apparently ground to a halt since mid-2016 and economic growth slowed. What it does not show is a decline in business investment, nor a halting of economic growth.
After these figures the report states:-
The reason that investment has been affected so much by the Brexit vote is that businesses fear that trade with the EU will be sufficiently costly in the future – especially with a no-deal Brexit – that new investment will not pay off. Greater clarity about the future relationship, especially removing the no-deal threat, might encourage some of that postponed investment to take place. But that would depend on the type of deal that is ultimately negotiated. A deal that preserved the current close trading relationship between the UK and EU could result in an upsurge in investment. In contrast, a deal that would make it certain that there would be more trade barriers between the UK and EU in the future would similarly remove the risk of no deal but at the same time eliminate the possibility of closer economic ties, offsetting any boost to economic activity.
This statement asserts, without evidence, that the cause of the change in investment trend is singular. That is due to business fears over Brexit. There is no corroborating evidence to back this assumption, such as surveys of business confidence, or decline in the stock markets. Nor is there a comparison with countries other than the UK, to show that any apparent shifts are due to other causes, such as the normal business cycle. Yet it is this singular assumed cause of the apparent divergence from trend that is used as the basis of forecasting for different policy scenarios a decade into the future.
The rest of this article will concentrate of the alternative evidence, to show that any alleged change in economic trends are either taken out of context or did not occur as a result of Brexit. For this I use World Bank data over a twenty year period, comparing to the Euro area. If voting to leave the EU has had a significant impact in economic trends
Net Foreign Direct Investment
There is no data for the narrow business investment at the World Bank. The alternative is net foreign direct investment.
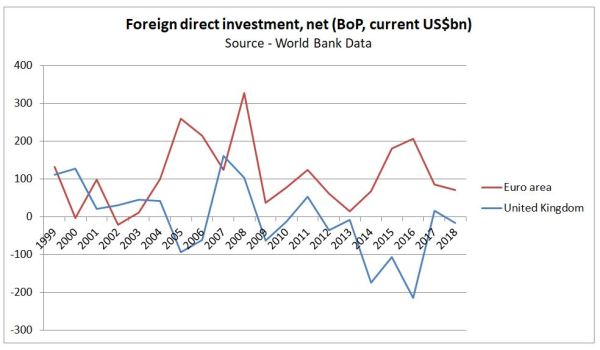 Fig 3 : Data for net foreign direct investment from 1999 to 2018 for the Euro area and the UK.
UK net foreign direct investment was strongly negative in 2014 to 2016, becoming around zero in 2017 and 2018. The Euro area shows an opposite trend. Politically, in 2014 UKIP won the UK elections to the European Parliament, followed in 2015 by a promise of a referendum on the EU. Maybe the expectation of Britain voting to leave the EU could have had impact? More likely this net outflow is connected to the decline in the value of the pound. From xe.com
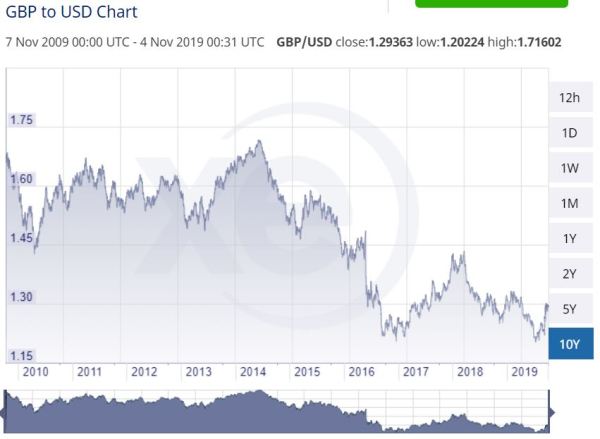
Fig 4 : 10 year GBP to USD exchange rates. Source xe.com
The three years of net negative FDI were years of steep declines in the value of the pound. In the years before and after, when exchange rates were more stable, net FDI was near zero.
GDP growth rates %
The NIESR choose to show the value of quarterly output to show a purported decline in the rate of economic growth post EU Referendum. More visible are the GDP growth rates.
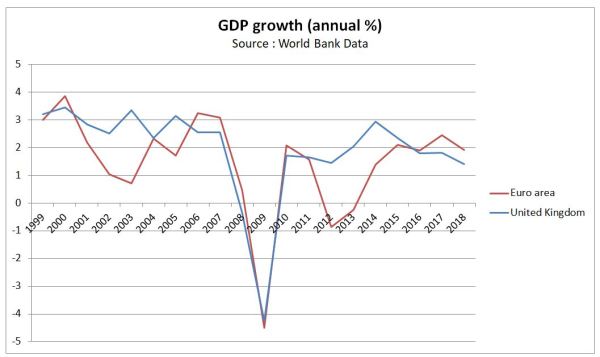
Fig 5 : Annual GDP growth rates for the Euro area and the UK from 1999 to 2018.
The Euro area and the UK suffered a economic crash of similar magnitude in 2008 and 2009. From 2010 to 2018 the UK has enjoyed unbroken economic growth, peaking in 2014. Growth rates were declining well before the EU referendum. The Euro area was again in recession in 2012 and 2013, which more than offsets the stronger growth than the UK from 2016 to 2018. In the years 2010 to 2018 Euro area GDP growth averaged 1.4%, compared with 1.5% for the years 1999 to 2009. In the UK it was 1.9% in both periods. The NIESR is essentially claiming that leaving the EU without a deal will reduce UK growth to levels comparable with most of the EU.
Unemployment – total and youth
Another matrix is unemployment rates. If voting to leave has impacted business investment and economic growth, one would expect a lagged impact on unemployment.
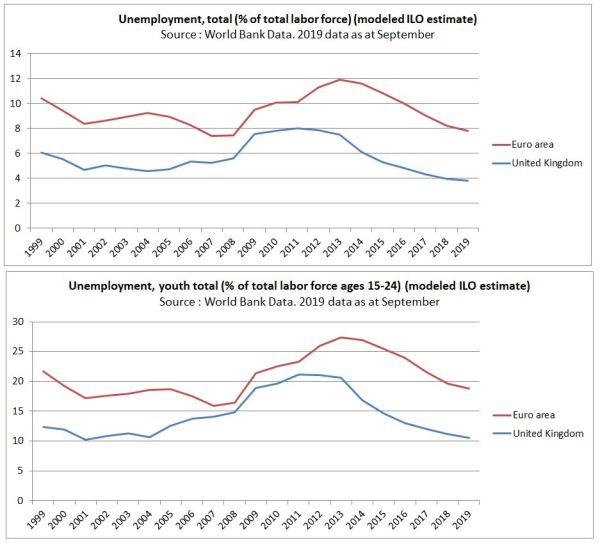
Fig 6 : Unemployment rates (total and youth) for the Euro area and the UK from 1999 to 2019. The current year is to September.
Unemployment in the Euro area has always been consistently higher than in the UK. The second recession in 2012 and 2013 in the Euro area resulted in unemployment peaking at least two years later than the UK. But in both places there has been over five years of falling unemployment. Brexit seems to have zero impact on the trend in the UK, where unemployment is now the lowest since the early 1970s.
The average rates of total unemployment for the period 1999-2018 are 8.2% in the Euro area and 6.0% in the UK. For youth unemployment they are 20.9% and 14.6% respectively.
The reason for higher rates of unemployment in EU countries for decades is largely down to greater regulatory rigidities than the UK.
Concluding comments
NIESR’s assumptions that the slowdowns in business investment and economic growth are soley due to the uncertainties created by Brexit are not supported by the wider evidence. Without support for that claim, the ten year forecasts of slower economic growth due to Brexit fail entirely. Instead Britain should be moving away from EU stagnation with high youth unemployment, charting a better course that our European neighbours will want to follow.
Kevin Marshall