Are BETRAYAL, SURRENDER and HUMBUG appropriate words to use in Parliament?

Prime Minister Boris Johnson used the words BETRAYAL, SURRENDER and HUMBUG in Parliament following the cancellation of prorogation. The proprietary of using such words I would contend, are in the first instance, dependent on the context used, rather than upon the sensitivities of those on the receiving end of such words. To establish context I will first quote definitions, then look at the context in which they were applied. 

BETRAYAL 

From the Cambridge Dictionary

An act of betraying someone or something, or the fact of someone or something being betrayed

Point 1 of the European Union Referendum Act 2015 states

The referendum

(1)A referendum is to be held on whether the United Kingdom should remain a member of the European Union.

(2)The Secretary of State must, by regulations, appoint the day on which the referendum is to be held.

(3)The day appointed under subsection (2)

(a)must be no later than 31 December 2017,

(b)must not be 5 May 2016, and

(c)must not be 4 May 2017.

(4)The question that is to appear on the ballot papers is—

Should the United Kingdom remain a member of the European Union or leave the European Union?

(5)The alternative answers to that question that are to appear on the ballot papers are—

Remain a member of the European Union

Leave the European Union.

(6)In Wales, there must also appear on the ballot papers—

(a)the following Welsh version of the question—

A ddylai’r Deyrnas Unedig aros yn aelod o’r Undeb Ewropeaidd neu adael yr Undeb Ewropeaidd?, and

(b)the following Welsh versions of the alternative answers—

Aros yn aelod o’r Undeb Ewropeaidd

Gadael yr Undeb Ewropeaidd.

The Referendum was for the eligible voters to decide by a simple majority vote on whether to Leave or Remain in the EU. I do not get any impression that the Referendum was merely advisory on Parliament. Nor I can see no meaning in the question that implies leaving the EU is contingent on getting a withdrawal agreement with the EU. It is a simple question of in or out, to be decided by the referendum.  Further, I aware in recent memory of Parliament failing to be abide by the results of referenda, even when it goes against the will of a majority. Nor can most political parties claim that they did not vote for the referendum. The vote on the Second Reading of the Bill was 544 to 53, with the 53 opposed coming from the SNP. 

This is further enforced in a biased pamphlet, the government posted to every household. The pamphlet started.

An important decision for the UK

On Thursday, 23 June there will be a referendum. It’s your opportunity to decide if the UK remains in the European Union (EU).

There is nothing advisory implied in that statement, nor does it imply leaving would only be in any way partial.

The conclusion was

A once in a generation decision

The referendum on Thursday, 23 June is your chance to decide if we should remain in or leave the European Union.

The government believes it is in the best interests of the UK to remain in the EU.

This is the way to protect jobs, provide security, and strengthen the UK’s economy for every family in this country – a clear path into the future, in contrast to the uncertainty of leaving.

This is your decision. The government will implement what you decide.

The heading clearly implies that there will be no second referendum to clarify the decision. The last sentence is a statement from the Conservative government of the time. However, in the campaign I was aware of the either Labour or the Lib Dems coming out and saying that they would not respect a vote to leave. Finally, is a letter I recieved dated 08.04.16 from Britain Stronger in Europe, who a few days later become the official Remain campaign. 

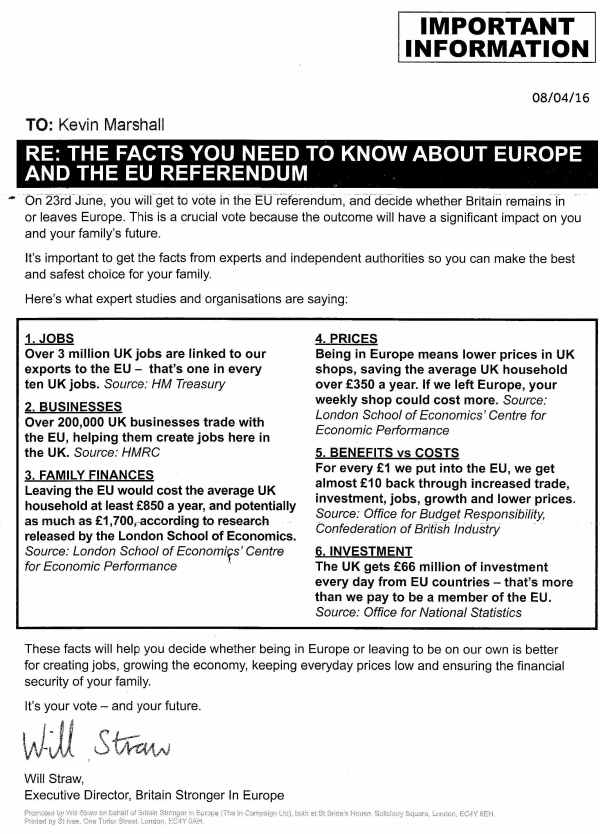
The first sentance states

On the 23rd June, you will get to vote in the EU Referendum, and decide whether Britain remains in or leaves the Europe.

Although confusing the EU grouping with the continent, it is quite clear that the remain campaign recognized at the time that it was up to the voters to decide.

So when over three years after the British people voted to leave the EU, parliament trying to block leaving the EU is not a “betrayal”? This cannot ne directed at the Scots Nats, but can be directed at some in the Conservative Party, the Lib Dems, the Labour Party and numerous MPs who have left the their parties in the last year.

SURRENDER

This word has a number of meanings at Free Dictionary

1. To relinquish possession or control of (something) to another because of demand or compulsion: surrendered the city to the enemy. See Synonyms at relinquish.

2. To give up in favor of another, especially voluntarily: surrendered her chair to her grandmother.

3. To give up or abandon: surrender all hope.

4. To give over or resign (oneself) to something, as to an emotion: surrendered himself to grief.

5. Law To effectuate a surrender of.

“Surrender” refers to the European Union (Withdrawal) (No. 2) Act 2019, sponsored by Hilary Benn PC. This Act will forces the Prime Minister to request extension of the withdrawal period until a withdrawal agreement has been agreed. It thus surrenders ability of the Executive to negotiate fair terms with the European Union as there is no ability to depart without an agreement. By so doing, the EU could impose onerous terms, denying any form of genuine independence for the UK from European Union. It thus gives the ability of the EU to send a very clear message to other nations who might consider leaving the club. Further it encourages the EU Council to break with the “plain aim” of Article 50 (3) of the two year withdrawal period, and any subsequent mutually agreed extension, of the “promotion of stability and certainty in the EU“. Further, it compels the executive to surrender its powers to achieve aims for which it has a constitutional mandate, to a legislature which has gained no mandate for its actions. Indeed, parliament has twice refused to call a general election to gain a mandate to, in substance, reverse the result of the EU Referendum.

Humbug

From the Mirriam Webster dictionary, the noun is defined as

1a: something designed to deceive and mislead Their claims are humbug. b: a willfully false, deceptive, or insincere person He’s just an old humbug. denounced as humbugs the playwrights who magnify the difficulties of their craft— Times Literary Supplement

2: an attitude or spirit of pretense and deception in all his humbug, in all his malice and hollowness— Mary Lindsay

3: NONSENSEDRIVELacademic humbug

4 Britisha hard usually peppermint-flavored candy

The use of the word “humbug” was used by the Prime Minister in response a emotional outburst from Paula Sherriff MP. The full exchange is below.

The claimed prejorative language referred to is in relation to the Benn Act included “betrayal” and “surrender“. As outlined above, these can be viewed by those who voted to leave as accurate terms to describe that has been happening in the House of Commons. In this context it is not prejorative (i.e. having a disparaging, derogatory, or belittling effect or force). In this context, the honourable member for Dewsbury’s comments can be perceived as insincere or deceitful. Given that around 57% voted to Leave in Dewsbury, and the town has a history of racial intolerance, it is not surprising. However, that is not to condone the vicious threats that have been made against MPs, including against Ms Sherriff. Instead there are strategies to minimize the impacts.

Strategies to minimize prejorative language or hate speech

I have some suggestions to minimize and diffuse the increasingly bad feeling in this country towards parliament, along with the increasingly polarized views. My concern is that this once great country is heading towards a quasi dictatorship, with fundamental questions of direction and ideology being put beyond democratic decision-making.

First, in terms of what is allowable in terms of speech, try to gain some objective standards. For instance, whilst Paula Sherriff objects to the word “betrayal” from the Prime Minister in relation to the biggest constitutional crisis in this country for decades she herself has used the word in relation to more trivial issues. The hard left in general, and Shadow Chancellor John McDonnell in particular, have long used language that encourages highly predjudiced, even hatred, towards opponents.

Second is to substantiate one’s claims based on the real world, not on mass hearsay. Then be prepared to defend these claims, showing them superior against the alternatives. There is a long tradition of this principle in English Common Law with trial by jury. The onus there is on the prosecution to prove their case beyond reasonable doubt, with the defence able to challenge the allegations made. This is overseen by a judge, who tries to ensure a fair hearing to both sides, and will take a very dim view of any attempt to undermine that fairness. In this respect I do not believe that a case can be made for a no-deal Brexit being catastrophic disaster. Rather there are risks of transitional issues, which a competent government should be able to mostly mitigate by sound policy. Further a no-deal Brexit can open up new opportunities, which a government with vision and optimism can either exploit, or stand back and let entrpreneurs expolit them,

Third, is for MPs to respect the mandate that they were elected on. On most issues it is expected that MPs should employ some pragmatism. But where there is a complete about-face on the central issue of their political careers,there is a responsibility for those politicians to seek a new mandate. Distrust in the democratic process will only be increased if politicians do an about-face and spurn the opportunity to seek a new mandate. Severely marginalizing a great mass of the people is a sure way to get civil unrest and calls for authoritarian government.

Kevin Marshall

President Trumps Tweet on record cold in New York and Temperature Data

As Record-breaking winter weather grips North-Eastern USA (and much of Canada as well) President Donald Trump has caused quite a stir with his latest Tweet.

There is nothing new in the current President’s tweets causing controversy. This is a hard-hitting one has highlights a point of real significance for AGW theory. After decades of human-caused global warming, record cold temperatures are more significant than record warm temperatures. Record cold can be accommodated within the AGW paradigm by claiming greater variability in climate resultant on the warming. This would be a portent of the whole climate system being thrown into chaos once some tipping point had been breached. But that would also require that warm records are
(a) far more numerous than cold records and
(b) Many new warm records outstrip the old records of a few decades ago by a greater amount than the rise in average temperatures in that area.
I will illustrate with three temperature data sets I looked at a couple of years ago – Reykjavík, Iceland and Isfjord Radio and Svalbard Airport on Svalbard.

Suppose there had been an extremely high and an extremely low temperature in 2009 in Reykjavík. For the extreme high temperature to be a record it would only have to be nominally higher than a record set in 1940 to be a new record. The unadjusted average anomaly data is the same. If the previous record had been set in say 1990, a new high record would only be confirmation of more extreme climate if it was at least 1C higher than the previous record. But a new cold record in 2009 could be up to 1C higher than a 1990 low record to count as greater climate extremes. Similarly in the case of Svalbard Airport, new warm records in 2008 or 2009 would need to be over 4C higher than records set around 1980, and new cold records would need to be up to 4C higher than records set around 1980 to count as effective new warm and cold records.
By rebasing in terms of unadjusted anomaly data (and looking at monthly data) a very large number of possible records could be generated from one temperature station. With thousands of temperature stations with long records, it is possible to generate a huge number of “records” to analyze if the temperatures are becoming more extreme. But absolute record cold records should be few and far between. However, if relative cold records outstrip relative warm records, then there are questions to be asked of the average data. Similarly, if there were a lack of absolute records or a decreasing frequency of relative records, then the beliefs in impending climate chaos would be undermined.

I would not want to jump ahead with the conclusions. The most important element is to mine the temperature data and then analyze the results in multiple ways. There are likely to be surprises that could enhance understanding of climate in quite novel ways.

Kevin Marshall

General Election Forecast based on Uniform Swing by Region

On May 15, YouGov produced a General Election opinion poll broken down by the eleven Regions of Great Britain. It seems impressive with 14395 GB Adults, plus 1040 London Adults, 1017 Scottish Adults and 1018 Welsh Adults. However, with fieldwork on 24 April to 05 May, it might be a little out of date. By combining this with the General Election Results by Constituency (available for the British Election Study) I have been able to produce a crude forecast for the General Election on June 8th.

The starting point in the General Election Results of May 2015, shown in Figure 1. Since then Con has gained 1 seat from Lab (Copeland), and lost a seat to LD (Richmond). The sole UKIP MP, Douglas Carswell, left the Party in March to become an Independent. These are ignored.

Note that the 18 Northern Ireland constituencies are not included. The 331 Con seats are against 326 for a majority in the House of Commons.

I made the following assumptions.

  1. Within each constituency, for each Party I have assumed the change in the vote is the difference between the regional share of the vote in 2015 and the opinion poll share from YouGov.
  2. If the constituency vote share in 2015 was less than the regional drop in vote share between 2015 and current opinion poll, then the vote is nil.
  3. A party may have a predicted vote despite not having a candidate. There are two instances where this is possible. First is that UKIP are not standing candidates in every constituency. Second is that the Progressive Alliance of Lib Dems, Greens, Labour and the SNP are standing down candidates to maximize the impact of the anti-Tory vote. Guido Fawkes’ summary of 16th May is here.

This simple model produces the forecast in Figure 2.

Implied Conservative majority is 128, up from 12 in the previous Parliament. The Lib-Dems also increase there number of seats, whilst SNP lose 9. UKIP’s “gain” is in Buckingham, the seat of the Speaker. This is due to a flaw in the crude model.

The Party gains by region are in Figure 3

Of note is that Labour do not gain a single seat, as YouGov estimate that their popularity has dropped in all but two regions. In the South East and the South West Labours’ presence is quite low. The SNP in Scotland lose seats to both the Conservatives and the Lib-Dems, but the loss of 9 seats is would still mean they have 47 of 59 seats.

These switches in seats are shown in detail in Figure 4.

My very crude forecast can be compared to the current forecast by Martin Baxtor at Electoral Calculus of Con 409, Lab 167, LD 7 & SNP 46. The Conservative majority is 168, 40 more than my own.

Another comparison is the mid-point of the spread betting at Sporting Index. This Con 399, Lab 159, LD 15.5, SNP 45.5. The implied Conservative majority is 148, bang in the middle of my own and Martin Baxters’.

In subsequent posts I intend to

  • Clear up the obvious errors.
  • Refining the forecast for Scotland based on the local election data of May 5th.
  • Look at the forecast for Wales, where I believe YouGov might be out of line with popular opinion.
  • Update in relation to more recent, but National, polling. For instance the recent strengthening of the Labour poll share and the fall in the UKIP share.

Kevin Marshall


Implications of the Forecast Local Council Elections Results in England, Wales and Scotland for GE 2017

Summary

I bring together Local Election forecasts for England, Wales and Scotland made over the past few weeks, before the General Election announcement a week ago. In the three countries I forecast that the Labour Party would lose 700 seats, and the Conservatives to gain over 500 seats. The most dramatic changes I forecast are in Scotland, where the Conservatives should end up with more seats than Labour, firmly cementing their place as the second party of Scotland. The SNP I forecast to have a net gain of 100 seats, despite likely losing seats to the Conservatives.
The impact of the snap General Election is likely to reinforce the dramatic exchange of seats that I forecast, with the additional impacts of (a) confirming the collapse in UKIP support; (b) highlighting the re-emergence of the Liberal Democrats as the major alternative to the Conservatives in much of England; and (c) providing a signal that the peak SNP dominance in Scotland has passed.


In the last few weeks I have made some results forecasts for the forthcoming local elections in England (here and here), Wales and Scotland occurring on May 4th. I was forecasting some big changes in numbers of seats. Since then a snap General Election has been called for June 8th. This may affect the forecasts, although given I have used mostly GE opinion polls, maybe not quite so much as local election forecasts based more upon recent local election by-election results. Rather than try to reforecast based upon widely fluctuating opinion polls (such as in last Sunday’s papers ), I will try to evaluate the impact of my forecasts being correct in the context of the narrative for the parties for the last few weeks of the General Election campaign.

In England, only a small proportion of councils are up for re-election. The 35 councils are a mixture of shire counties and unitary authorities. They are predominantly in areas with Conservative members of parliament, although there is also the Labour stronghold of Durham, along with Lancashire and Derbyshire where Labour managed to regain council majorities in 2013. In terms of councils involved, this is a very low number. There were 124 English councils with elections in 2016 and 279 in 2015. Entirely absent are any council elections in the major English cities.

In Wales and Scotland all council seats are up for re-election. Although with similar numbers of council seats in the two countries as the English councils, these are far more significant politically.

Figure 1 summarizes my forecasts of seat changes for each country both against the last elections in 2012 and 2013 and the previous round of elections in 2007 and 2008.

I believe that a major influence on the UK local election results is the state of national opinion. This is in general direction of opinion and not the percentage share of the vote. For instance, in 2007 and 2008 the Labour Government was trailing the Conservatives by quite a long way in the opinion polls – possibly as much as 15 points. By 2012 and 2013 the situation was reversed, with Labour in opposition being around 8 points ahead of the Conservatives. Proportionately, Liberal Democrats as the junior partner in a coalition government, suffered greater reversals than the Conservatives.  This is strongly seen in the English council results, with the exception of the UKIP factor. The 2013 council elections demonstrated a game-changing http://www.bbc.co.uk/news/uk-politics-22382098 rise of UKIP outside of elections to the European Parliament.  In Wales, the National Opinion influence is less marked, but it is still there. Scotland is the least influenced by National Opinion trends, as there are strong factors unique Scottish factors, such as the replacement of the Labour Party with the SNP as the major left of centre party.

Before looking at the likely consequences for the General Election, I have shown the approximate forecast council seat numbers in figure 2.

Political Implications of the English Council Results

With hindsight my UKIP seat estimate is probably too high. But even if they retain 40 to 50 seats it will still be a major reversal on 2012. It will be very hard to convince voters in England – especially in the pro-Leave areas of the country – that they are a credible alternative political party, whether on Brexit or populist issues such as immigration.

The Liberal Democrats fell into third place behind Labour in 2013. I will be very surprised if that they do not regain second place. Expect to see a lot made of being in most of Britain the only credible alternative to Conservative pro-Brexit juggernaut.

The Labour Party will excuse the results as being in Tory areas, claiming that there is a different picture in the rest of England, particularly in London. They will try change the conversation to winning the mayoral elections in Manchester and Merseyside.


Political Implications of the Welsh Council Results

Plaid Cymru might only make small gains, and it will be in a limited number of areas. They will use this to persuade voters of being an anti-Brexit and pro-Welsh voice. By softening the Welsh language aspects, they might seek to extend their reach beyond the West Coast.

The Liberal Democrats will look at actual council successes to drive home their Pro-Remain message, particularly in the capital, where they will be looking to regain Cardiff Central.

For the Conservatives, coming in third place behind Plaid Cymru, despite large gains, may give confidence to other parties. If they come second (and/or regain control of the two councils lost in 2012) then this will be a landmark achievement. A YouGov opinion poll for Cardiff University and ITV on 24/04/17 of voting intentions for the Welsh local elections gave Labour 28%, Conservatives 26% and Plaid Cymru 19%, against my assumptions of 29%, 16% and 17%. The main inaccuracy of the poll I believe is that it calculates Independents plus minor parties at 12%, half the level of 2012. I assume a 1% gain. Given such varied support across the councils, along with first asking General Election opinions, it is easy to understand how this discrepancy might arise. However, it will be the actual results that will decide who has the greater accuracy.


Political Implications of the Scottish Council Results

It is in Scotland that the results will reverberate most strongly if my forecasts are correct. There are a couple of points to remember about the peculiar Scottish context.

First is that Scotland is embarking on the third set of council elections using the single transferable vote system (STV), with council areas divided into supersized wards of three or four seats. It means that if a party selects too many candidates in a ward, they may end up with less Councillors elected as candidates of the same party compete against each other for votes. They parties therefore try optimization of candidates based on forecasts. As I found, the Labour Party, instead of optimization based on a dramatic forecast fall in their vote, chose to largely match candidates with existing Councillors. They are therefore likely to lose proportionately more seats as a consequence of this quite rational decision.

Second, is the growth in the SNP means that the change in the vote from council election to council election does not strongly reflect the swings in the UK-wide opinion polls over the same period. For instance, although the Labour share of the vote in 2012 was higher than in 2007, the rise was much smaller than the SNP rise in vote share. However, I still forecast SNP vote share to increase, resulting in a net gain in Councillors. But these net gains will include very large gains in Labour councils, such as Glasgow, alongside loses elsewhere, especially to the Conservatives. There will be a strong message for those who oppose independence that the SNP juggernaut might have peaked and could signal the turning of the tide on the Independence issue.

Lib Dems may not have a significant showing, as in many areas where they are strong in the Westminster elections, are where there is a strong representation of Independents. Indeed, the councils of Orkney and Shetland, where the Lib Dems have their only Scottish MP, are all Independents. Whether they will win over some votes as the party of double-Remainers, remains to be seen. An extensive Scottish Yougov poll  published in January, but based on sampling in late 2016, showed that the double-Remainers were 28% of voters. That includes 21% who voted in one or none of the two referendums.

From my forecast the Conservatives will easily replace Labour as the second political party represented on Scotland’s councils. Due to Labour having too many candidates, they could pick up seats in unexpected areas. Conversely, if the Conservative surge continues, then Ruth Davidson may end up apologizing for having too few candidates, as vote share in some wards might easily elect the available candidates.


Implications for the UK General Election

A loss of 700 seats across three countries would be a huge message that the Labour Party under Jeremy Corbyn’s leadership was heading for an even worse result than in 1983. The benchmark in England and Wales would be the woeful results of 2007 and 2008, which were 530 seats lower than the last set of elections, compared to my forecast of 455 seats lost.

The Conservatives will want to downplay strong gains in England and Wales in case complacency reduces turnout on June 8th. But they will want to emphasize their confirmed position as the opposition in Scotland.

The Liberal Democrats will announce that they are back, and concentrate on gains made in particular areas where they are clearly the main opposition to the Conservatives Hard Brexit. They will emphasize any gains they might make in the council areas where they had Westminster MPs until 2015.

UKIP may lose more than the rounded 100 seats I forecast. It will show that, unlike in 2015, they are no longer the protest vote of the disaffected. Given that their main cause has been achieved, and supporting the Conservatives is the surest way to ensure Brexit is enacted in full, this may signal the end of the UKIP as a national force on June 8th.

The biggest losers could end up being the SNP, despite their likely winning control of a number of councils and destroying the Scottish Labour Party. Their demonisation of the Conservative and Unionist Party as the subjugators of the Scots will not hold as much sway when the spread of their Councillors is much broader than in living memory and the Conservative voter is more likely to be your own neighbour.

Kevin Marshall

Is the Rawlings and Thrasher English Elections Forecast a bit timid?

At the weekend I posted my forecast for the English council elections to take place on May 4th, using a comparison with opinion polls both now and 2013, along with the forecast made by Harry Hayfield at Political Betting.

On Sunday, The Times published a forecast from Colin Rawlings and Michael Thrasher, both Professors of Politics at the University of Plymouth.

Again they use local by-election results a a basis for their forecast, and come up with similar results to Hayfield for the Lib-Dems (+9%) and UKIP (-12%). The biggest difference is with Labour, predicting no change, as against -4% for Hayfield. More relevant is the forecast for seats, where they predict Conservative +50, Labour -50, Lib Dem +100, UKIP -100

Despite these chaps having considerable experience of election data, having written a number of post-election reports for the Electoral Commission, I believe that their forecasts might be somewhat out. This I have split into share of the vote and seat predictions.

Rawlings & Thrasher share of the vote prediction

I have summarized some data in figure 1.

Rawlings & Thrasher base their forecast on the Notional National Change, so I have shown the difference between those figures and the General Election Opinion Polls. There are reasons why the local council elections are different from the opinion polls, aside from the fact that opinion polls may not fully reflect actual decisions.

In 2013 UKIP benefitted in the local elections as people used their vote as a protest against the Coalition Government and/or in support of an EU Referendum.  That no longer exists as Brexit is underway; whilst UKIP is in disarray and has fund-raising issues. In this I would agree with Rawlings and Thrasher in a huge drop in support for UKIP, swinging from outperforming the opinion polls, to underperforming.

With the Liberal Democrats, I would agree that they should not only outperform the opinion polls, but do so by a greater margin than in 2013, when being in Coalition Government damaged their brand as being the alternative to the Conservatives in the non-socialist areas. This year they may also benefit as being the Party of those most opposed to Brexit. But the actual share of the vote was 20%. For the notional share of the National Vote to rise nine points would indicate a larger rise to over 30% of the actual vote. It would effectively make the arch-Remainers effectively the biggest beneficiaries of the fall in support for UKIP. That is possible, but would imply very large underlying switches in effective party support. Also, this large net increase in Lib-Dem vote share would be despite no net movement in the general election opinion polls in the last five years. Even if local by-elections results indicate such a swing, when voting for full councils I do not believe that this will replicate this result.

The forecast for Labour to have no change from 2013 is perhaps the most out of line with reality. Just four years ago Labour seemed likely to be in a position to be win the 2015 election. Now they are 13 points lower in the opinion polls. Most of the councils concerned are in the Conservative heartlands, with Labour traditionally trailing in third place. They thus have less far to fall than nationally, but barring a miracle in the next four weeks, they will lose vote share.

By difference, this leaves the Conservatives making much larger gains that 5% of the Notional National Vote.

Rawlings and Thrasher seat change predictions

This I think is the most timid part of the seat changes to repeat they are

Conservative +50, Labour -50, Lib Dem +100, UKIP -100

Prof John Curtice on the Sunday Politics thought, based upon a 12 point swing in the opinion polls, Labour could suffer a much bigger loss of seats than the 50 forecast by Rallings and Thrasher. (hattip Guido Fawkes)

But to get an idea of the likely level of seat changes, it is worth looking at the changes in the similar (but not quite identical in terms of seats and councils) council elections in 2009 and 2013. These, from Wikipedia (here and here) are shown in Figure 2.

Please note that the numbers do not quite stack up due to (a) one more council in 2013 (b) boundary changes (c) by-elections. But broad comparisons can still be made.

UKIP gained 139 seats in 2013. The swing from 2009 to 2013 was probably greater than the counter swing they will likely suffer next month, so the loss of 100 seats is a reasonable estimate.  Similarly the Lib Dem estimate of 100 seats gain seems about right, despite the likely net change in fortunes maybe be less at a National level not likely nearly countering the loss in popularity between 2009 and 2013.

When it comes to Labour, they are nationally in a worse position than in 2009. So their loss of seats could be greater than then suffered in 2009. A reduction of 300 seats, or nearly 60% of the defended seats, seems a reasonable forecast, with a 200 seat loss or less being a relatively good night for Labour with their current unpopularity.

The Conservatives should easily be the biggest gainers. Most of the councils are in Conservative Heartlands. Others, like Lancashire and Derbyshire, are where they have managed majorities in the recent past. Yet in 2013 the Conservative share of the vote was below that achieved in the UK as a whole in the General Election just two years later. Two years after the General Election, the party is in a considerably stronger position, so should gain considerably. A gain of 300 seats is my forecast.

Final points

An aspect to consider in local elections is the impact of turnout. In their report on the 2013 English and Anglesey Council Elections, Rawlings and Thrasher noted that turnout was 31%, compared with over 39% in 2009.

In the similar 2009 report they note that this turnout was higher than in the previous three years.

Could the relatively high turnout be due to the confidence of Conservative voters? In 2009 the Conservative vote was 44.5%, 10% higher than in 2013. Labour had a 12.7% share (over 8% lower) and Lib-Dems were at 24.9% (5% higher). Then the Conservatives were a year away from going back into Government. In 2013, they looked like reverting to opposition. In 2017, there is a new sense of optimism among Conservative supporters, not seen since the end of the Falklands War – or at least with their Brexit supporters. These are concentrated in the middle-aged and older people, among whom turnout is usually higher than in the population at large. On the other hand, the Labour-supporting Remainers might stay at home, being doubly-demoralised. The change in seats could be even bigger than in either 2009 or 2013.

These are of course my forecasts compared with those of others who have more experience in these matters. What is crucial is how analyzing the difference between forecasts and actual results can deepen our collective understanding of what is happening in an interesting period in British history.

Kevin Marshall


Local Elections Forecast May 2017

At Political Betting Harry Hayfield has produced a forecast for the County Council elections in May 2017, just six weeks away. I have long followed this blog, though I neither bet nor follow the politics of the blog propriotor Mike Smithson (Lib-Dem & Pro-Remain on Brexit). However, it is the very differences that provide an alternative perspective. Harry Hayfield’s basic assumptions County Council elections in England are:-

In the local by-elections, areas that voted REMAIN saw the following change:
Con -9%, Lab -4%, Lib Dem +12%, UKIP -12%, Greens 0%, Ind -10%, Others +23%
Where as areas that voted to LEAVE saw the following change:
Con +4%, Lab -4%, Lib Dem +7%, UKIP -9%, Greens +1%, Ind +4%, Others -3%

With any forecast there is a lot of work involved in converting these into seats. Any baseline, when compared to the actual results will help develop an understanding of both of National opinion in turbulent times and also how it impacts at the local politics. What I would note is that the Counties are mainly Conservative territory; has a large Independent / Other representation (though this has been declining for decades); and is predominantly Remain voting, but not extremely more than the UK average.

But that said Harry Hayfield’s forecasts seem to be at odds with the opinion polls. Taking the UK Polling Reports opinion poll figures for (a) 28/04/13 to 10/05/13 and (b) 05/02/17 to 19/02/17 (the latest available) the change in voting intention is about

Con +11%, Lab -13%, Lib Dem +0%, UKIP -2%, Greens +2%.

Since then the Conservatives and Lib Dems at improved slightly at the expense of UKIP and Labour. The latest YouGov figures, for 25-27 March,  are

Con 43%, Lab 25%, Lib Dem 11%, UKIP 10%

And the change on 2013 are about

Con +13%, Lab -14%, Lib Dem +1%, UKIP -4%

The actual share of the vote – skewed by being counties – was

Conservative 34.3%, Labour 21.1%, UKIP 19.9%, Lib Dem 13.8% and Green 3.5%

therefore – Other 7.4%

In terms of the County Councils, perhaps 85% were for Leave in the EU Referendum, on the basis that maybe three-quarters of Parliamentary Constituencies in in England and Wales voted for Leave, and most of the Remain vote was in the Metropolitan areas. So why should the Conservatives only improve by 4% in most of the Council areas on 2013 when they are 13% up in the opinion polls nationally?

Harry Hayfield’s assumptions diverge from the opinion polls from being based upon recent by-elections nationally. That is upon a maybe half a dozen by-elections a week, These one-off events usually have low turnouts, and are highly impacted by protest votes.  The biggest reason for protest votes at the present time is the Brexit issue. It will have an impact on the local elections, with the Remain protest vote being stronger than the Leave support vote. But this will be much less than in by-elections due to (a) higher turnout due to area-wide elections (b) higher turnout on average as the counties tend to have higher turnout than the Metropolitan areas (c) the protest vote is concentrated in the cities, especially London. The latter is evidenced by the two recent very large petitions to change the referendum rules after the EU referendum and to cancel the State Visit of President Trump.

That said, using by-election results is a as good as any considering the political landscape has changed dramatically in the past four years. By using clear assumptions on forecasts it is possible to understand where they go wrong. But that understanding will be only on the empirical differences between forecast and actual. What I will now do is to give a forecast based on reasons (maybe my unfounded opinions) with some notes on the parties. This might muddy the waters a bit, but here goes.

For UKIP 2013 elections were a “game-changer“, to use Nigel Farage’s term. UKIP then got nearly double the share in the County vote as in the National opinion polls. A party campaigning on a single national issue made huge gains on votes at local government level. The 20% of vote share was a precursor to the 26.6% in the European Parliament elections achieved in 2014.  This impact is now gone, and the grassroots support needed to field and promote thousands of candidates may have diminished due to internal strife. Local by-elections may not fully reflect this impact, as they can concentrate their much reduced resources. UKIP’s share may go below the National Opinion polls. On these grounds I will go for a -13% change on 2013, giving UKIP 7% of the vote.

The Liberal-Democrats, are usually the main opposition to the Conservatives in the Counties and also usually perform much better than in General Elections. In 2013 they were in Coalition with the Conservatives, which severely damaged their standing as a local opposition. The 13.8% of the vote was 3-4% ahead of the opinion polls. This margin might not be much more than in previous 20 years, but in those years the Lib-Dems were doing much better nationally. Any bounce I believe will be mostly due to being the respectable face of hard-line opposition to Brexit. This could be bet positive, but put some folks off voting for them on local issues. I would guess at an increase of 5% giving the Lib-Dems 19% of the vote.

The Labour Party cannot fall nearly as far in the English Counties, where support is much lower than the national average. At the end of April and beginning of May 2013 they were polling 38-39% nationally, but achieved 21.1% of the vote. Will they still fall? In 2013 they managed to overtake the Lib-Dems with 538 to 352 seats, as against 247 to 476 in 2009, so the 21.1% was actually an improvement. Nationally Labour are doing worse (or at least no better) than in 2009. What is more, they have lost a lot of their working class base, which would have formed some of the core support in the Counties. I would estimate a 5% fall.

The Independents were once a major contingent in local politics, but only achieved 7.4% of the vote in 2013. How will this go? I would hope for an increase as people vote again for local representatives based on local issues. With the decline of UKIP, and maybe the Lib-Dems tarnished in the eyes of some for going very anti-Brexit, I think they may gain ground to around 10%. The Greens maybe the same.

By difference, the Conservatives will have a 11% increase in the vote share to 45% of the vote share. This is fairly similar to the change in national opinion polls over the last four years (from 30 to 41%). Indeed, it might be a low estimate, as in 2013 the Coalition Government was suffering from normal mid-term blues. At present, the Government is in the unusual position of being significantly more popular than when elected.

So, in conclusion, Harry Hayfield’s estimate was as follows

In the local by-elections, areas that voted REMAIN saw the following change:
Con -9%, Lab -4%, Lib Dem +12%, UKIP -12%, Greens 0%, Ind -10%, Others +23%
Where as areas that voted to LEAVE saw the following change:
Con +4%, Lab -4%, Lib Dem +7%, UKIP -9%, Greens +1%, Ind +4%, Others -3%

The LEAVE areas are at least 5 times more than the REMAIN areas. My estimate, for all English areas with a complete council elections in 2013 & 2017 is as follows.

Con +10%, Lab -5%, Lib Dem +5%, UKIP -12%, Ind/others +2%.

It is the actual results that will matter, and possible lessons to be learnt during a time of massive change in British politics.

Kevin Marshall

Australian Car Industry – When in a hole stop digging

At Jo Nova’s unthreaded there is a debate going on about Australian car industry. Started up in the post war era, it is currently going through a crisis. In fact, despite large subsidies, it is collapsing. The major messages I want to get across are:-

  • Learn from other countries. Britain in the 1970s for instance.
  • When in a hole, stop digging. If the car industry is failing, throwing money at it might win a few votes, but damage the economy.
  • Australians have the energy, and entrepreneurial skills, in abundance to create new wealth-generating opportunities.
  • Australians (like other countries) are being crippled by the short-sighted hand of Government, who should recognize that do not have the skills, nor the incentives required to create an industrial policy that is of net benefit to the country as a whole.

On making a new start and learning the lessons of Brazil

To successfully start a new car company is virtually impossible in the modern world. In recent decades the successful ones have been in China, but with the help of, and by copying, established marques. Outside of China, there was Proton of Malaysia. There original car was a 1984 Mitsubishi Lancer. That end of the market you do not want to get into – high subsidies and reliant on cheap labour. The last major car company start-up was (I believe) Honda.
Then there are niche markets. McLaren is doing well in the UK, but a midget and building on its F1 base. As the majority of F1 cars are made around Silverstone, it had an advantage of a skilled labour pool and (most importantly) the engineering and design skills.
The alternative is to do what Brazil did. For years it did not allow any imports. There were four foreign car companies building in Brazil (Fiat, Ford, GM and VW). The quality was shocking, models were decades older than Europe and the the companies colluded. VW built a variant of the Ford Escort and the Beetle came off Ford production lines. In 1994, they opened up to imports, but with a 25% import tax. Very quickly 70-80% of the market was imports. So the Brazilians stuck a 70% tax. The response over a decade was for more foreign companies to open assembly plants. Then came Mercosur – the “free-trade” zone covering most of South America. Now there are plants from Renault, Mercedes (mostly the A-class), Audi and Volvo amongst others.
The major problem of taking this route is the restriction of choice. The Mercosur market (including Brazil, Argentina and Mexico) is a number of times bigger than Australia, and last time I looked, had a more limited choice and higher prices than in Europe.
Learn for Australia what the biggest businesses did in the 1980s. Stick to what you are good at. Let the market develop in Australia based on its comparative advantages. That is farming (which you have developed from low margin sheep farming to high margin wine production) and mining. Then there is tourism as well, so long as you don’t let your government tax air travel.
In the longer term there are spin-off industries. In Britain we don’t have much manufacturing, but we have some of the world’s best designers. Oil production is declining, but a disproportionate amount of global off-shore technological expertise is around Aberdeen.
The mistake of most people to associate wealth with making actual things. It is not. Wealth is about creating greater value than the inputs. Assembling everyday, easily reproducible, objects adds very little value, so is confined to the poorest countries. For instance textiles in Bangladesh, or assembly of commodity items in China. The real wealth comes from new ideas, or taking existing processes and doing them more efficiently and/or effectively than anyone else. That is staying ahead of the game.

A readable primer on the economics is Israel Kirzner’s “Competition and Entrepreneurship.”

When in a hole, stop digging. Lessons of the British Experience

Andrew McRae is torn between ending the subsidies and letting the car industry fold.

Hi Andrew,

I can see why you are torn between Government Industrial policy and letting free markets work. I finished high school and went to university during the early Thatcher years and saw both sides. In the 1970s one of the most famous British cars was the MG Midget – a tiny two seater sports car. There were huge protests when production was stopped, with each car costing twice the selling price. Like most of the cars produced in Britain it was unreliable, particularly when compared with the Japanese competition. The country subsidised many industries, spending 5-8% GDP on subsidies. We tried to get into the computers – and failed. The one bright spot was Concord, developed with the French. A phenomenal technological achievement, it cost £4bn (A$40bn+ in todays money) and the few made were virtually given away. It was a case study in how an original government project at low cost with high rewards switches to the opposite. When mooted in the mid-50s, it was to cost £80m with a market for hundreds of planes.

One thing that you must not lose sight of is the existing workers in your car industry. In Britain in the 1970s there were millions employed in manufacturing, whether the car industry, steel, shipbuilding, engineering, or technology assembly lines. Another 250,000 jobs were in coal mining. Many who were made redundant in their 50s never got jobs again. Many others only obtained lower paid unskilled work. There is still incredible bitterness towards the whole Thatcher legacy. But the fault lay not with ending “industrial policy”, with its ever-growing subsidies, but in starting it in the first place. It is the same principle as for the carbon tax. Even assuming the theoretical case was true, the people least qualified to implement the policy are the politicians. Not because they cannot hire the best experts to devise a policy. It is for business and a carbon tax to work you need to make changes, which will hurt people. In manufacturing you need to continually cut jobs and change. With an “optimal” policy to reduce CO2 emissions some jobs need to be destroyed (to get huge benefits) and people suffer hardship. Politicians who are so openly ruthless get voted out pretty quickly, even though they are doing the best for the country. The best long-term interests of the country are the biggest vote losers, if those politicians are advised think short-term and are advised by spin doctors. Yet the interests of a modern developed country are in providing the structures to enable the future wealth-creating opportunities to develop. Australia is probably the pre-eminent example of a country for this to happen, as there are many people with vision, ability and the passion to make things happen, along with the ability to take risks. The crippling disability that they need to overcome is the risk-averse dead-hand of government who cannot see beyond the next set of opinion polls.

The Summer Riots – causes and prevention

Whilst I was away on holiday in Pembrokeshire, riots broke out in the cities of London, Birmingham and Manchester. The following comment was just posted to John Redwood’s blog:-

We should look at this in context. All the riots except the first in Tottenham were copycat riots. People saw that with sufficient numbers of people, looting could be carried out without fear of arrest. There was also the adrenalin rush of rioting, just like football hooliganism. The rioting stopped when people started being arrested in large numbers. They also stopped in Manchester when it started raining.

We should not overreact in issuing draconian laws. Rather it is to understand that people react to the opportunities presented to them. We had in the inner cities for a few nights to opportunity to riot and loot in the belief there would be no punishment. Many took that opportunity. This can be gleaned from the work of Prof. Gary S. Becker, who pioneered the study of the economics of crime.

Prevention of the riots in the near future might simply be to show that many of those who rioted had been caught. Therefore the belief that criminal acts in a riot would go unpunished is a false one. Beyond this, there might some minor changes. First, by more rapidly escalating the intensity of Police action in an area and nationally. Second, by instituting temporary powers of arrest in, or near, riot areas for those covering their faces. Third, if riots are in the summer, for helicopters to spray water to simulate a heavy downpour. The water might also contain a harmless dye visible under ultraviolet light (that can be removed with soap and water) to identify those who duck into side streets.

The ideas are minor. They will not quell a serious political riot – but the more serious riots of the 1980s in Brixton & Toxteth were also stopped by the rain. These are superficial “shopping riots“*. They are only a reflection of a breakdown in society insofar as there are large sections of society who lack the moral sense to respect property and other people even when there appears to be no possibility of being caught for breaking the law. The rule of law needs to be respected by vast majority of people for the vast majority of the time for civil society to exist. Otherwise, the peace can be maintained only by draconian laws and thuggish law enforcement. In such authoritarian societies the civil peace is maintained only by fear of arbitrary arrest and restraint of peaceful activities.

*This is not an endorsement of David Starkey’s other comments on the subject.

John Redwood and the BNP

Blogger Ralph Musgrave in comments to John Redwood’s posting “Finding our National Identity” claims that John Redwood and the rest of the Conservatives have been moving towards the BNP. This is my response.

A sure sign of extremism is to point to superficial similarities, over the substantive ones. In this case the use of a word – Identity – over these points of difference with the BNP.


1. Praising the left for making racism unacceptable.

2. “(W)e should also dislike those who think there is a single or pure British way which they wish to enforce.” Sounds like a dig at the BNP.

3. The ideas of Britain having emerged into a tolerant democracy.

4. Anyone who was moving towards the BNP position would not have written this posting:-

http://www.johnredwoodsdiary.com/2011/02/05/the-tyranny-of-ideas/


I categorize extremism as falling two types. The first is the numerical type – those who hold ideas distinct from the numerical majority, or mainstream. The second is those who hold ideas that cannot be substantiated by rational argument, or who are highly intolerant of others.

I believe that John Redwood has sometimes taken extreme positions of the first type – usually for well-argued reasons. The BNP falls into the second category.

UKIP did not lose the Tories the Election

The notion that UKIP lost the election for the Conservatives is erroneous.

This claim originated by Richard North on EU Referendum, and repeated by Conservative Home (with figures), John Redwood and Cranmer.

UKIP cater for a niche of voters who would otherwise (mostly) vote Conservative. However, a mainstream party cannot cater for all tastes. If the Tories became more euro-sceptic to squeeze the UKIP vote, they would most probably have lost more votes to the Lib-Dems and Labour. Any main-stream political party must be a broad church. The problem with our current political opinion is that we had two left-of-centre parties that got over 50% of the vote, a mainstream right-of-centre party that got 36% of the vote and UKIP that got 3%.

The conclusion for the Conservatives is not to try to appeal to a very broad church by merging many different opinions. Rather, they must capture a vision that people can empathise with, as did New Labour and Thatcherism. The time to introduce this was not with the launch of the manifesto, but two or three years before an election. Further that vision should also be an implicit attack on the alternatives.

A positive vision to vote for; and the opposing failures to vote against.