At Euan Mearn’s blog I made reference to my findings, posted in full last night, that in the Isfjord Radio weather station had adjustments that varied between +4.0oC in 1917 to -1.7oC in the 1950s. I challenged anyone to find bigger adjustments than that. Euan came back with the example of Windhoek in South Africa, claiming 5oC of adjustments between the “raw” and GISS homogenised data.
I cry foul, as the adjustments are throughout the data set. J
That is the whole of the data set has been adjusted up by about 4 oC!
However, comparing the “raw” with the GISS homogenised data, with 5 year moving averages, (alongside the net adjustments) there are some interesting features.
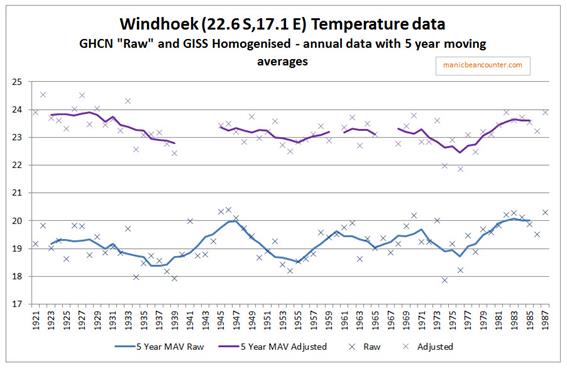
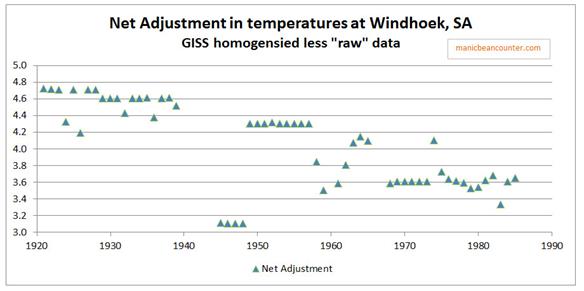
The overall temperatures have been adjusted up by around 4oC, but
- From the start of the record in 1920 to 1939 the cooling has been retained, if not slightly amplified.
- The warming from 1938 to 1947 of 1.5oC has been erased by a combination of deleting the 1940 to 1944 data and reducing the 1945-1948 adjustments by 1.4oC.
- The 1945-1948 adjustments, along with random adjustments and deletion of data mostly remove the near 1.5oC of cooling from the late 1940s to mid-1950s and the slight rebound through to the early 1960s.
- The early 1970s cooling and the warming to the end of the series in the mid-1980s is largely untouched.
The overall adjustments leave a peculiar picture that cannot be explained by a homogenisation algorithm. The cooling in the 1920s offsets the global trend. Deletion of data and the adjustments in the data counter the peak of warming in the early 1940s in the global data. Natural variations in the raw data between the late 1940s and 1970 appear to have been removed, then the slight early 1970s cooling and the subsequent warming in the raw data left alone. However, the raw data shows average temperatures in the 1980s to be around 0.8oC higher than in the early 1920s. The adjustments seem to have removed this.
This removal of the warming trend tends to disprove something else. There appears to be no clever conspiracy, with a secret set of true figures. Rather, there are a lot of people dipping in to adjusting adjusted data to their view of the world, but nobody really questioning the results. They have totally lost sight of what the real data actually is. If they have compared the final adjusted data with the raw data, then they realised that the adjustments had managed to have eliminated a warming trend of over 1 oC per century.
Kevin Marshall

Euan Mearns
/ 05/03/2015Kevin, the early view, developed in part by Paul Homewood, was that homogenisation was adding warming to records. I set off to do epic job on Australia and showed this was not the case. Some records are warmed, some are cooled and the net effect is zero. I have post on southern Africa that should fly Friday that shows same.
Interesting post on Windhoek. What you should see tomorrow is that homogenisation straightens out all the natural variance – as your post shows. I think its still possible that such massive adjustments are in there to make the homogenisation algorithm balance. You make a point that homogenisation in this case has removed a warming trend – don’t forget that it also added 4˚C 😉
manicbeancounter
/ 05/03/2015Hi Euan,
The previous post on Spitzbergen / Svarlbard also showed a reduction of a warming trend.
It was very good work you did on Australia. This indeed showed that the adjustments, on average, had no net effect on warming trend. But there is still a purpose to doing this. To homogenise is to blend together. It removes the background “noise” from the data. By then treating the homogenised data as if it were adjusted data (that is with distorting anomalies such as station moves and changes is the method of measurement) a closer statistical fit is achieved to the climate models. But homogenised data has no statistical validity. By also removing local variation, it also removes the clues to a much more complex understanding of climate.
A C Osborn
/ 05/03/2015From the work that I did last year on USA temperatures involving the “E” Estimated values, as I have said before, it appeared to me that it was not a simple case of lowering the past to increase the warming.
It also included reducing the Step changes that were apparent from things like ENSO and AMO changes. These step changes do not fit in with the Gradual, continuous rise due to CO2 increases.
I am not sure if either of you have seen Steve Goddard’s graph of Adjustments v CO2 , the adjustments are an almost perfect fit, whereas the Temperatures are not.
manicbeancounter
/ 05/03/2015A C
Thanks for the comment. I also think the pattern of adjustments is much more complex. In fact, the more stations I look at, the richer is the adjustment pattern. I was not aware of Steve Goddard’s graph, though I think there might be more complexity than adjusting to a global average. One thing I look for is the impact of adjustments on the relative magnitudes of the recent warming episode to the early twentieth century one.
Brian H
/ 06/03/2015Eliminating “the 1940s spike” which disproves AGW?