Bishop Hill posts on a You-tube video “13 Misconceptions About Global Warming” from Veritasium (Dr Derek Muller), inviting readers to play a sort of bingo to “spot all the strawmen arguments, cherrypicking, out of date data, and plain old mistakes”. Here is my attempt, restricted to just 13 points.
-
“Global warming” / “climate change” naming. It might be true that people can deny global warming by pointing to a localized cold weather snap. But it is also true that using the term “climate change” can result in any unusual weather event or short-term trend being blamed on anthropogenic global warming, along with natural global fluctuations. The term “global warming” reminds us that the adverse effects on climate are as a result of rising greenhouse gas levels warming the atmosphere. More importantly the use of the term “global” reminds us those changes in climate due to changes in greenhouse gases is a global issue requiring global solutions. Any mitigation policy that excludes 80% of the global population and two-thirds of global carbon emissions, will not work.
-
Veritasium claims climate change is also about more extreme weather and ocean acidification, not just the average surface temperature is warming. But there is nothing in the greenhouse gas hypothesis that says a rise in temperatures will result in more extreme weather, nor does Veritasium provide the evidence of this happening. At Wattupwiththat there is a page that demonstrates weather is not getting more extreme from a number of different measures.
-
Claim that it has not stopped warming as 13 of the 14 hottest years are in this century. This is a strawman, as there was significant warming in the last quarter of the twentieth century. We would only fail to have hottest years if global average temperatures had taken a sharp step decrease.
-
Claims that taking the satellite data of global temperature anomalies into account shows that warming has not stopped. From Kevin Cowtan’s page (copied by Skeptical Science) we can calculate linear trends. It is the RSS satellite data that shows the longest period of no warming – 18 years from 1997-2014 based on the linear trend. It is just 13 years for GISTEMP and 14 years for HADCRUT4. The other satellite data is UAH, where there is just 6 years of no warming.
-
What he is doing is comparing UAH satellite data that only shows the pause from 2009. There is now 35 years of satellite data, with the total recorded trend of 0.48oC. The RSS data shows 0.51oC of warming. The surface thermometer measures vary between 0.59 and 0.63 oC of warming. This is data cherry-picking.
-
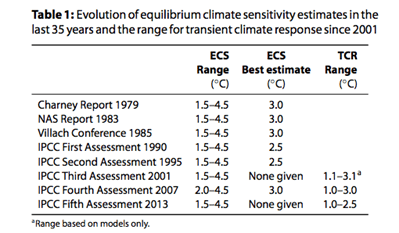
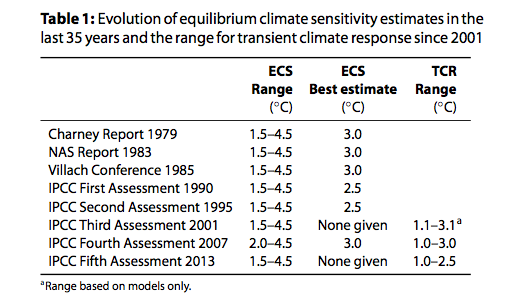
There is a claim that climate sensitivity is lower than thought in the 1980s. Not according to Nicholas Lewis, who found that the range of sensitivities is unchanged from the Charney Report 1979 through to AR5 WG1 of Sept-13
-
Claims the central estimate for warming from a doubling of CO2 is 3.0oC of warming. Based on this from 2001 from HADCRUT4 shows no warming there would be 0.30oC of warming, when the trend from HADCRUT4 is zero. In a longer period from 1979 for which we have satellite data, an increase in CO2 from 336.8 to 398.5 ppm (Mauna Loa data) implies an increase in temperatures of 0.72oC – between 1.14 on 1.5 times greater than that measured by the temperature series. Even this is misleading, as there was no warming from 1944 to the late 1970s. In 1944 I estimate that CO2 levels were 308ppm, indicating a total warming in the last 70 years of 1.1oC, respectively 1.7 and 2.1 times greater than the trend in GISTEMP and HADCRUT4.
-
This would appear to contradict this graph, which has no proper labelling showing have 3.0oC of doubling affects temperatures.
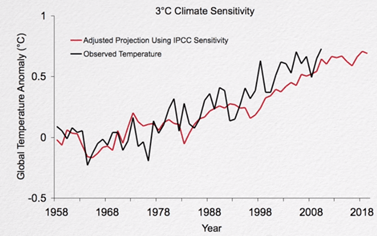
Specifically from 1958 to 1980 CO2 rose from 315 to 339ppm, indicating warming of about 0.31 oC, but there was no warming in the IPCC projections. A rise in CO2 of 315 to 398.5 ppm from 1958 to 2014 would predict 1.0 oC in warming, almost double the actual data and the IPCC projections. Another point is with the “observed temperature”. It is not identified (probably GISTEMP) and ends on the high of 2010.
-
Completely ignores the other greenhouse gases that contribute to warming, such as methane and halocarbons.
-
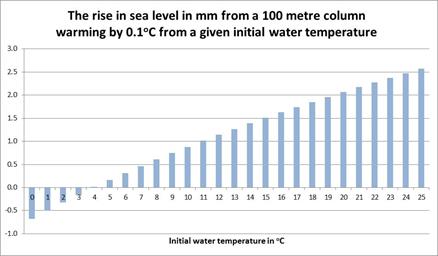
Claims that sea level rise is another indication of global warming, through thermal expansion. This is not necessarily the case. The average temperature of the ocean is 3.9oC. A rise of to 4.0 oC will have zero expansion. If the rise in sea temperatures is confined to the Arctic or in the deep oceans where temperatures are below 4.0 oC, a rise in temperatures would mean a fall in sea levels. Below I have compiled a graph to show the expansion of a 100metre column of water by 0.1 oC from various starting temperatures.
-
On Arctic Sea ice, is correct in saying that the 40% uptick in the last two years ignores the longer period of data. But in turn, Veritasium ignores evidence pre-satellites that were fluctuations in sea ice. Further, the uptick occurred at precisely the year when previous experts had predicted that summer sea ice cover would disappear. As a consequence, contraction of the sea ice is both less severe and less likely to be linked to human-caused warming than previously thought.
-
Correctly points out that water vapour is the major greenhouse gas, but incorrectly claims to have evidence that water vapour is increasing in the atmosphere. The evidence is from a graphic from a 2007 PNAS paper.
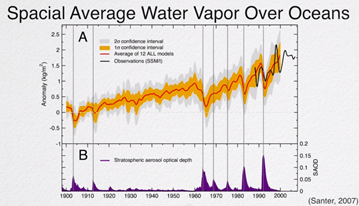
The evidence from 1900 is the average of 12 models. The confidence intervals are utter rubbish, appearing to be related to the magnitude of the average modelled anomaly. The actual (estimated) data in black does not have a confidence interval. It would appear that this estimated data has a step increase at roughly the time, or slightly before, when the warming stopped in the surface temperature records.
- Policy justification is totally wrong.
Veritasium says at 5.35
I’m not claiming it’s going to be some sort of crazy catastrophe, but we are going to get more intense storms, more droughts and floods, the oceans will become more acidic, sea levels will rise and my point is it would be better for all species on this planet and probably cheaper for us if we just started reducing emissions now than if we wait and pay the consequences later.
Every economic justification of policy projects “some sort of crazy catastrophe” that human being and other species will not be able to adapt to. Further they project that global emissions reductions will be both effective and relatively costless, which is contradicted by the evidence. But most of all, there is no political proposal in the climate talks that will reduce global emissions in the next twenty years. The proposals may only constrain the rate of increase.
Kevin Marshall

Brian H
/ 01/01/2015Since temp gradients and clashes of air flows are steeper in cooling and cooled climates, weather is most severe then; a warm Earth would be a placid Earth. Bring it on, I say! Unfortunately the mechanisms and tools proffered by AGW are bogus and ineffectual, so we’ll have to face the end of the interglacial disarmed.
manicbeancounter
/ 01/01/2015I agree. This temperature gradients is something that Richard Lindzen has long said and is obvious to anyone with a basic understanding of climate.
The policy recommendations being “bogus and ineffectual” is something I have looked at before.
https://manicbeancounter.com/tag/1st-draft/
It exists on a number of levels. Here are just four.
1. On technology – such as solar – renewables don’t deliver
2. At a country level – you will not get enough countries participating in emissions reductions
3. Nobody thinks through policy, nor implements it.
http://joannenova.com.au/2015/01/carbon-tax-cost-5310-a-ton-15-billion-to-abate-almost-nothing-and-cool-the-world-by-even-less/
4. Failures are excused or falsely blamed on others
HaroldW
/ 01/01/2015Kevin –
The graph in #8 is unattributed in the video, but is from SkS. The author (Dana) claims — I take nothing for granted at that site — that the “adjusted projection” is derived from Hansen’s 1988 “B” projection curve, having reduced its gain (presumably scaling by 1/1.1) because scenario B forcing was about 10% higher than observed, and further reduced its gain (presumably by a factor of 3.0/4.2) to approximate a 3.0 K ECS rather than the 4.2 K ECS of Hansen’s model.
In other words, Hansen’s 1988 “B” curve didn’t get forcing quite right and was pretty far off on sensitivity. But if we change those fundamentals retrospectively, we can make it match up. That constitutes a prediction showing “remarkable agreement with observations”, according to Veritasium.
manicbeancounter
/ 01/01/2015Harold,
Thanks for the comment. It is interesting to find out where the source of the graph comes from. It was from another Dana article that I got the formula for calculating ECS from. Rather than 3.0K ECS it works out at 2.94K ECS. Similarly I copied Dana in calculating ECS with zero lags.
There is another issue with this comparison. Dana will have used the older set of GISTEMP data that I downloaded a couple of months earlier in 2011. When I compared this with the data set in April 2014, I found that the OLS linear warming trend for 1998-2010 in the GISTEMP data had nearly halved in three years. This brought it more into line with HADCRUT.
The earlier data set had been produced whilst James Hansen was still in charge. Since he has retired someone has been bringing GISTEMP into line with other data sets.
At least there is a source of Veritasium’s claim that the central estimate of climate sensitivity has been reduced. It seems that he used Hansen’s rather than other sources that Nic Lewis found. Given that two years later the FAR report used 3.0K, it would seem that Hansen was outside the mainstream even then.
HaroldW
/ 01/01/2015Actually the FAR didn’t use 3.0 K; they considered 2.5 K to be the best estimate.
“The range of results from model studies [for ECS] is 1.9 to 5.2°C. Most results are close to 4.0°C but recent studies using a more detailed but not necessarily more accurate representation of cloud processes give results in the lower half of this range. Hence the models results do not justify altering the previously accepted range of 1.5 to 4.5°C….Taking into account the model results, together with observational evidence over the last century which is suggestive of the climate sensitivity being in the lower half of the range, […] a value of climate sensitivity of 2.5°C has been chosen as the best estimate.” As far back as the FAR, it was recognized that models were running warmer than observations.
So it is partly correct that estimates of sensitivity have decreased, in the sense that models’ ECS no longer cluster near 4.0 K. For comparison, the CMIP3 group of models (AR4) have a mean ECS of 3.2 K, median=3.2, range=2.1 to 4.4. CMIP5 (AR5): Mean=3.2 K, median=2.9, range=2.1 to 4.7.
Knowing that Hansen worked for GISS, I looked up the characteristics of recent GISS models. AR4: both GISS-EH and GISS-ER produced an ECS of 2.7 K. AR5: GISS-E2-H reported a 2.3 K ECS, while GISS-E2-R reported 2.1 K. A far cry from the 4.2 K of the mid-80s version.
manicbeancounter
/ 01/01/2015Harold,
Thanks again for coming back with a well-researched comment. The full story is often more nuanced than the summary. I will update the point 8 accordingly tomorrow.
BC
/ 02/01/2015Average sea temperature of 4 degrees Celsius is not relevant, sea surface temperature, not average ocean temperature is what should be of interest. The observed increase in sea level comes from a higher average sea surface temperature, as well as the melting of land ice. I found your analysis on modelings interesting, but I wouldn’t dive into that field unless your willing to study years of applied physics and mathematics, it takes a really long time to understand even the basics.
Also of note, the department of defense considers climate change a great threat, because it will increase conflict in many parts of the world.
manicbeancounter
/ 02/01/2015The sea surface temperatures are as irrelevant as the average temperature. The thermal expansion is a three-dimensionsal problem, as temperature varies with depth. Also thermal expansion of water varies with temperature.
The major issue with computing the thermal expansion is not the physics and the math. It is with have the data to compute. Data is not available in sufficient detail to compute the expansion over a number of years without making assumptions. Once you make assumptions – or model the data – potential errors can be enormous.