The now withdrawn Gergis paper proudly proclaimed in the abstract
The average reconstructed temperature anomaly in Australasia during A.D. 1238-1267, the warmest 30-year pre-instrumental period, is 0.09°C (±0.19°C) below 1961-1990 levels.
On this basis, Gergis was able to say
A preliminary assessment of the roles of solar, volcanic, and anthropogenic forcings and natural ocean–atmosphere variability is performed using CSIRO Mk3L model simulations and independent palaeoclimate records. Solar and volcanic forcing does not have a marked influence on reconstructed Australasian temperature variations, which appear to be masked by internal variability.
This conclusion is from a single rogue proxy – the coral proxy from Palmyra Atoll.
There were only three temperature proxies covering this medieval peak period. Both Mt. Read in Tasmania and Oroko in New Zealand are tree ring proxies that cover the entire millennium. The Palymyra Atoll coral proxy data covers just 398 years over 4 periods. These are 1151-1221, 1319-1465, 1637-1704 and 1888-1999. Following Gergis, I have calculated the decadal averages. Below is the plot from my pivot table for the three proxies.
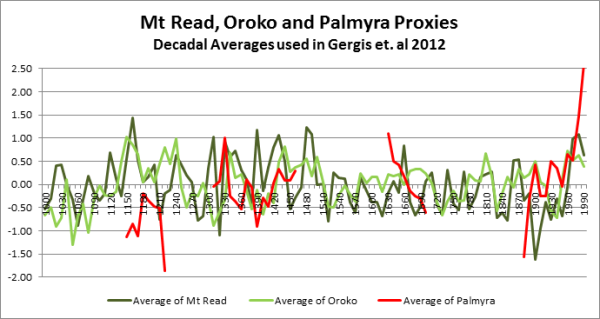
I contend that Palmyra is distinctly “odd” due to the following.
- Nowhere in the world am I aware of a single instance of massive cooling during the early 13th Century. If not rogue data, the it must be a purely local phenomena.
- Nowhere in the world am I aware of a single instance of massive cooling during the 17th Century. Nor was I aware the early 17th century had significant warm period. If not rogue data, it must be a purely local phenomena.
- The Hadcrut3 global temperature set has slight cooling at the end of the 19th century / start of the 20th Century, and a warming period from 1910 to 1940 almost as large as the warming period from 1975 to 1998. If not rogue data, it must be a purely local phenomena.
- The post 1960 warming trend is phenomenal. In fact it makes the twentieth century warming trend the largest of all the 27 proxies. (See table “Analysis of the Proxies in Gergis et al. 2012” below)
For these three reasons it would appear to be an outlier. So what is the impact?
I looked at the decadal average of the two tree-ring proxies and ranked the hundred decades from 1 for the highest to 100 for the lowest. I then took the decadal average of the three tree-ring proxies and similarly ranked the results.
The change is the decadal ranking was as follows:-
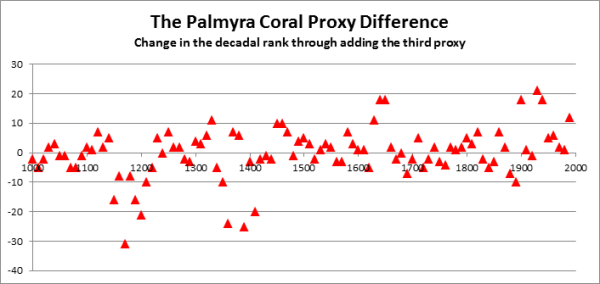
The medieval warm period is suppressed, and the twentieth century is “enhanced”.
Now let us be clear. There were 24 other proxies in the data set. However, none of the others were prior to 1430. Therefore the impact on the overall ranking will not be quite so marked. However, the fact remains that the conclusion that last decade of the 20th century is the warmest of the millennium is based on this one rogue data set.
But there are two more reasons that the Palmyra data set should not have been included in the reconstruction.
Firstly, the Gergis paper was withdrawn upon the publication of the JeanS ‘Gergis Significance’ t-values. Unsurprisingly, Palmyra was one of the proxies that failed the t-test, so is a rogue data set. See table below.
Secondly, is geography. The study is a “temperature reconstruction for the combined land and oceanic region of Australasia (0°S-50°S, 110°E-180°E)“. Palmyra Atoll is located at 5°52′ N, 162°06′ W, or over 2100Km (1300 miles) outside the study area.
Conclusion.
The Palmyra Atoll coral proxy study is clearly an outlier statistically and geographically. In no way can it be considered a suitable proxy for the Australasia region, yet the major, headline, conclusion of the Gergis et al 2012 temperature reconstruction relied upon it.


Martin A
/ 12/06/2012“0.09°C (±0.19°C)” When I was a student, such a value, with such a error range, would have been considered entirely meaningless. Is this no longer the case?
manicbeancounter
/ 12/06/2012In most areas it is – but Climate Scientists has risen above such tedious things. They know the ultimate truth. Therefore, anything that supports the science has to be correct.
Sonny
/ 13/06/20121. Where can I download the proxie data used in this reconstruction?
2. How do they establish an error band anyway? I would have thought that some kind of statistical averaging of 27 proxies would create a much larger error?
manicbeancounter
/ 13/06/20121. I will try to find the link later as it is now gone from my browsing history. Like the paper, it may have been taken down.
2. The error band is established by taking the 27 proxies and running 3000 “reconstructions”. It is nothing to do with real world data.
Sonny
/ 13/06/2012Oh I see!
So the low error band is generated by running the same garbage analysis 3000 times. Just illustrates how computers don’t get any better at picking up on faulty methodology even when you make them repeat the same calculation ad infinitum.
manicbeancounter
/ 13/06/2012I have found the link – and it is still live
http://www.ncdc.noaa.gov/paleo/pubs/gergis2012/gergis2012.html
My analysis inverted the coral proxies. They all go one way – so that is legit. One thing that might be worth charting is the three tree ring proxies with a C20th decline in temperatures. If post 1960, it would seem that the decline in “hide the decline” of Climategate emails is a global phenomena.
The error bar issue is something that Steve McIntyre has never got involved in – he once said so in response to a comment I made a couple of years ago. However, the true figure, although is not calcuable is a compound of:-
1. The ability of the proxies to replicate known temperature variations. Look at the table to get an idea. The Vostok ones are good – same place, same study, with different techniques. Rarotonga and Fiji are small islands.
2. The sample size. 27 for nearly 10% of the globe is not good.
3. Sample distribution. 5 outside the area. Reliance on tree ring proxies from Tasmania & New Zealand, Nothing for the sub-continent of Australia……
By the way. The Climate Models which say that there is a 95% of 1.5 to 5 degrees of warming this century suffer from the exact same problem. They are an error range generated by the models. If you get the data parameters wrong – like a doubling of CO2 causing 0.4 degrees of warming instead of 3 degrees that the models assume on average – then the “predictions” are totally wrong.
Brian H
/ 16/06/2012Incomplete sentence: “But there are two more reasons that the Palmyra data set.”
This study has to be one of the most iconic demonstrations of confirmation bias evah! Assuming they believed what they wrote, and weren’t just trying to slip one past everyone. (Fat chance with Steve M. on the case!)
manicbeancounter
/ 17/06/2012Brian,
Incomplete sentence now completed. Thanks for pointing this out.
Your comment “This study has to be one of the most iconic demonstrations of confirmation bias evah!” may be true, although its prominence may be due to timely publication of data.
It might be worth creating a catalogue of the errors for statistics courses. – From the most basic (e.g. Geography) to the more complex.