This post is a slight modification and extention of a comment made at the cliscep post The Latest Antarctic Ice Sheet Alarmist Con
As a (slightly manic) beancounter I like to reconcile data sets. The differing estimates behind the claims of accelerating ice mass loss in Antarctica do not reconcile, nor with sea level rise data.
The problem of ice loss needs to be looked at in terms of the net of ice losses (e.g. glacier retreat) and ice gains (snow accumulation). Any estimate then needs to be related to other estimates. The Guardian article referred in the cliscep post states
Separate research published in January found that ice loss from the entire Antarctic continent had increased six-fold since the 1980s, with the biggest losses in the west. The new study indicates West Antarctica has caused 5mm of sea level rise since 1992, consistent with the January study’s findings.
The paper is Rignot et al 2018 “Four decades of Antarctic Ice Sheet mass balance from 1979–2017“. The abstract states
The total mass loss increased from 40 ±
9 Gt/y in 1979–1990 to 50 ± 14 Gt/y in 1989–2000, 166 ± 18 Gt/y
in 1999–2009, and 252 ± 26 Gt/y in 2009–2017. In 2009–2017,
the mass loss was dominated by the Amundsen/Bellingshausen
Sea sectors, in West Antarctica (159 ± 8 Gt/y), Wilkes Land, in
East Antarctica (51 ± 13 Gt/y), and West and Northeast Peninsula
(42 ± 5 Gt/y). The contribution to sea-level rise from Antarctica
averaged 3.6 ± 0.5 mm per decade with a cumulative 14.0 ±
2.0 mm since 1979, including 6.9 ± 0.6 mm from West Antarctica,
4.4 ± 0.9 mm from East Antarctica, and 2.5 ± 0.4 mm from the
Peninsula (i.e., East Antarctica is a major participant in the mass
loss).
Jaime @ 19 May 19 at 7:56 am points to a New Scientist article in January claiming that Antartica ice loss has trebled. The underlying article is from Nature – The IMBIE Team – Mass balance of the Antarctic Ice Sheet from 1992 to 2017. The abstract states
The Antarctic Ice Sheet is an important indicator of climate change and driver of sea-level rise. Here we combine satellite observations of its changing volume, flow and gravitational attraction with modelling of its surface mass balance to show that it lost 2,720 ± 1,390 billion tonnes of ice between 1992 and 2017, which corresponds to an increase in mean sea level of 7.6 ± 3.9 millimeters (errors are one standard deviation). Over this period, ocean-driven melting has caused rates of ice loss from West Antarctica to increase from 53 ± 29 billion to 159 ± 26 billion tonnes per year; ice-shelf collapse has increased the rate of ice loss from the Antarctic Peninsula from 7 ± 13 billion to 33 ± 16 billion tonnes per year. We find large variations in and among model estimates of surface mass balance and glacial isostatic adjustment for East Antarctica, with its average rate of mass gain over the period 1992–2017 (5 ± 46 billion tonnes per year) being the least certain.
The key problem is in the contribution to sea level rise. The Rignot study from 1979-2017 gives 3.6 mm a decade from 1989-2017, about 4.1 mm and from 1999-2017 about 5.6 mm. The IMBIE team estimates over the period 1992-2017 7.9 mm sea level rise, or 3 mm per decade. The Rignot study estimate is over 50% greater than the IMBIE team. Even worse, neither the satellite data for sea level rise from 1992, nor the longer record of tide gauges, show an acceleration in sea level rise.
For instance from NOAA, the satellite data shows a fairly steady 2.9mm a year. rise in sea levels from 1992.

Using the same data, the University of Colorado estimates the average sea level rise to be 3.1 mm a year.

Note that in both the much greater variability in the Jason 2 data, and the slowdown in rise after 2016 when Jason 3 started operating.
The tide gauges show a lesser rate of rise. A calculation from 155 of the best tide gauges around the world found the mean and median rate of sea level rise to be 1.48 mm/yr.
Yet, if Rignot is correct in recent years Antarctic ice loss must now account for around 22-25% of the sea level rise (satellite record) or almost 50% (tide gauges) of the measured sea level rise. Both show no accleration. What factors have a diminishing contribution to sea level rise over the last 25 years? It cannot be less thermal expansion, as heat uptake is meant to have increased post 2000, more than offsetting the slowdown in surface temperature rise when emissions accelerated.
Kevin Marshall
Postscript
This is not the first time I have covered rather extreme claims in one of Prof Eric Rignot’s estimates of accleration in ice melt. Six years ago I looked at Rignot et al 2011 – Acceleration of the contribution of the Greenland and Antarctic ice sheets to sea level rise
I compared the 12 monthly rise in sea surface temperatures with the corressponding chart of ice mass balance loss for Greenland and Antarctica. The peaks and troughs corressponded nicely, with about 18 months between ice loss and sea level rise. This is quite remarkable considering that from Rignot et 2011 in the 1990s ice loss would have had very little influence on sea level rise. It is almost as though the modelling has taken the sea level data, multiplied by 360, flipped it, moved it back a few months then tilted to result show acceleration.
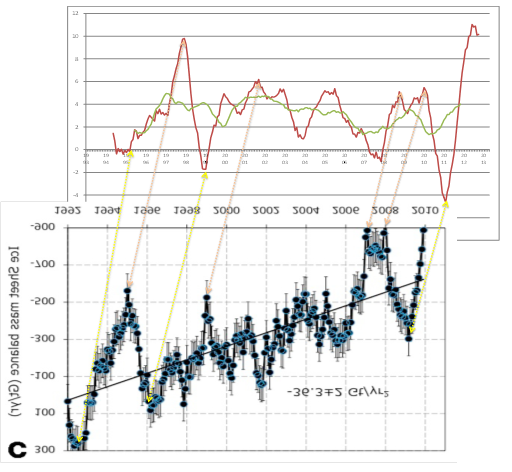
Yet the acceleration of 14.5 ± 2 Gt/yr2 for Antarctica results in decadal increases not too dismillar from those in the abstract of Rignot et al 2018. This would validate the earlier results except for another paper. Shepherd et al Nov 2012 – Reconciled Estimate of Ice-Sheet Mass Balance had a long list of authors including Rignot and three of the four co-authors of the Rignot et al 2011. It set the standard for the time, and was the key article on the subject in IPCC AR5 WG1. Shepherd et al Nov 2012 has the following Table 1.
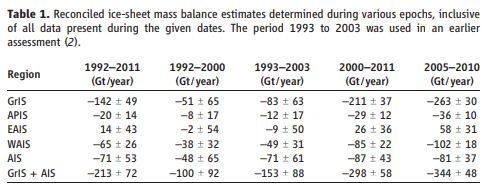
For Antartica as experienced no significant acceleration in ice mass loss in the period 1992-2011.

Jaime Jessop
/ 21/05/2019The rate of sea level rise appears not to be accelerating, as claimed by Shepherd et al. It seems quite likely that sea level rise is being driven by non-catastrophic thermal expansion combined with moderate losses of glacial ice and that if there has been an acceleration in ice losses at the coastal margins of the WAIS (spreading into the interior) and Greenland then this must be offset by a deceleration in the rate of thermal expansion and/or an increase in the rate of snow accumulation.
manicbeancounter
/ 21/05/2019Thanks for the comment Jaime.
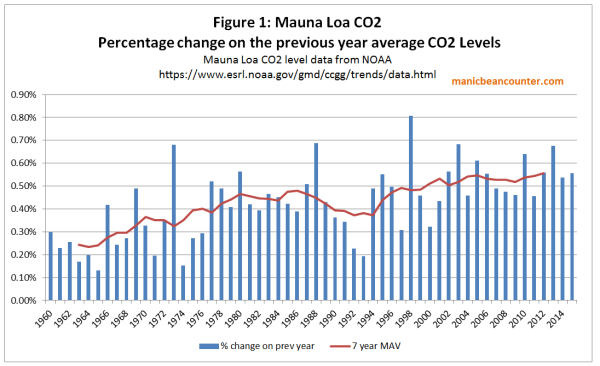
I can see two main reasons for preferring Shepherd et al. 2012 over the 2018 papers from the IMBIE Team and Rignot. That is it is an agreed upon consensus paper, and it is more in line with the evidence. That is if one either follows Post-Normal Science, or conventional scientific methods it is preferable. But for the conventionalists, it still leaves unexplained anomalies. If ice mass loss is accelerating, and sea level rise is not then sea-level rise due to thermal expansion must be decreasing. That goes against the accelerating rise in CO2 levels. Below is a graph I produced in December 2016.
If (a) CO2 is the major driver of warming, and (b) most of that warming for decades disappears into the oceans then thermal expansion should be at least be a constant or increasing contributor to sea level rise over decades. The fact that the data does not support increasing contributions from both thermal expansion and ice mass loss should be something troubling to genuine scientific enquirers. Conflicts between received wisdom and observations are often the seed of scientific breakthroughs.