Last month I looked at the claims by the UK Environmental Audit Committee warning of 7,000 heat-related deaths in the 2050s, finding it was the result a making a number of untenable assumptions. Even if the forecast turned out to be true, cold deaths would still be more than five times the hot deaths. With the hottest summer since 1976, it is not surprising that there have been efforts to show there are excess heat deaths.
On the 6th August, The Daily Express headlined UK heatwave turns KILLER: 1,000 more people die this summer than average as temps soar.
Deaths were up in all seven weeks from June 2 to July 20, which saw temperatures reach as high as 95F (35C).
A total of 955 people more than the average have died in England and Wales since the summer began, according to the Office for National Statistics (ONS).
On the 3rd August the Guardian posted Deaths rose 650 above average during UK heatwave – with older people most at risk.
The height of the heatwave was from 25 June to 9 July, according to the Met Office, a run of 15 consecutive days with temperatures above 28C. The deaths registered during the weeks covering this period were 663 higher than the average for the same weeks over the previous five years, a Guardian analysis of data from the Office of National Statistics shows.
Note the Guardian’s lower figure was from a shorter time period.
I like to put figures in context, so I looked up the ONS Dataset:Deaths registered monthly in England and Wales
There they have detailed data from 2006 to July 2018. Estimating the excess deaths from these figures needs some estimation of other factors. However, some indication of excess deaths can be gleaned from taking the variation from the average. In July 2018 there were 40,624 recorded deaths, as against an average of 38,987 deaths in July in the years 2006-2018. There were therefore 1,637 deaths more than average. I have charted the variation from average for each year.
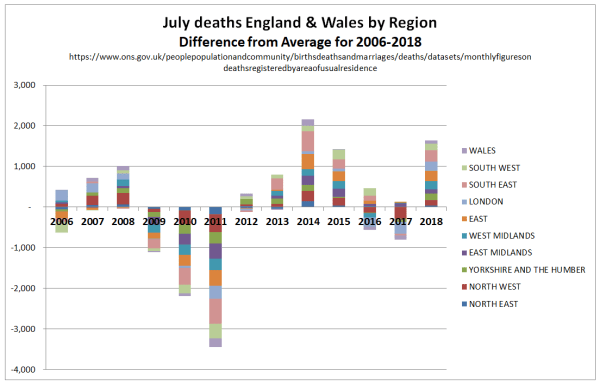
There were above average deaths in July 2018, but there similar figure in the same month in 2014 and 2015. Maybe the mean July temperatures from the Central England Temperature Record show a similar variation?
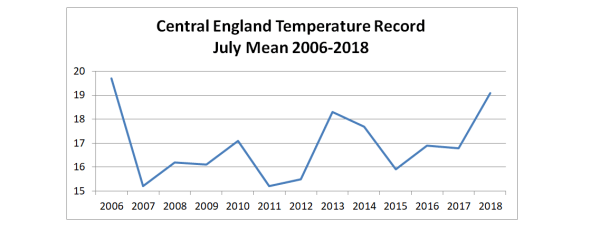
Not really. July 2006 had high mean temperatures and average deaths, whilst 2015 had low mean temperatures and higher than average deaths.
There is a further element to consider. Every month so far this year has had higher than average deaths. Below I have graphed the variation by month.
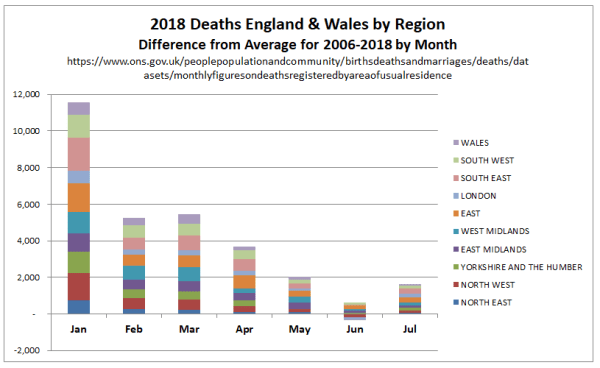
January is many times more significant than July. In the first seven months of this year there were 30,000 more deaths recorded than the January-July average for 2006 to 2018. But is this primarily due to the cold start to the year followed by a barbecue summer? Looking at the variations from average 300,000 deaths for the period January to July period, it does not seem this is the case.
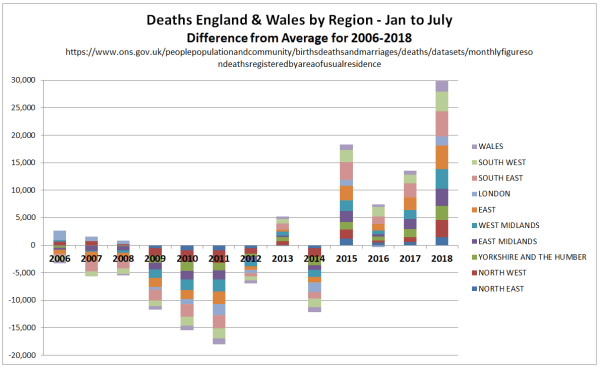
Looking at individual months, if extreme temperatures alone caused excess deaths I would expect an even bigger peak during in January 2010 when there was record cold than this year. In January 2010 there were 48363 recorded deaths, against 64157 in January 2018 and a 2006-2018 average of 52383. Clearly there is a large seasonal element to deaths as the average for July is 39091, or three-quarters of the January level. But discerning the temperature related element is extremely tricky, and any estimates of excess deaths to a precise number should be treated with extreme caution.
