More than 24 hours overdue there is a political resolution to
Brexit that will form the basis of a withdrawal agreement. It is
enthusiastically endorsed by both Boris Johnson and Jean-Claude Juncker. Further,
the EU appears to be ruling out any extension of the withdrawal period beyond
31st October. Therefore, the Benn Surrender Act, forcing to the
Prime Minister to request an extension in the event of parliament failing to
pass the agreement, will be meaningless. It takes two tango, and the EU looks to
be tired of the dancing.
From a quick read of the document I have extracted some points, and made notes of my opinions. The copy was obtained from Guido Fawkes. I have uploaded the document here. I would commend people to read it themselves before passing judgement. My overall view is that
- Like the Church of England, the declaration has a very British feel, being short on detail and a lot of fudge.
- There are some points that are troubling, such as on fisheries.
- It ratchets into UK law common elements of EU and British politics. Whilst many parts are laudable (e.g. co-operation on security issues and maintenance of human rights) others are reflect current pervasive ideological fads. A liberal democracy should be able to separate the two elements, but in this age of mass and baseless opinions it is the latter that is more important than the former. Traditionally in Britain, it has been common principles that have upheld liberal democratic principles
- It includes good principles of “a level playing field” and understanding other points of view. Such principles are clearly out of fashion in the current politics of the remainers and the hard left.
- There is no trace of being bound by EU Law beyond 2020, nor of having to support EU projects financially for an indefinite period.
- As I state at the foot of the article, the substance might be irrelevent to whether this declaration is accepted by pariament.
On with the extracts.
II. GOODS – A. Objectives
and principles includes
20. These arrangements will take account of the fact that following the United Kingdom’s withdrawal from the Union, the Parties will form separate markets and distinct legal orders. Moving goods across borders can pose risks to the integrity and proper functioning of these markets, which are managed through customs procedures and checks.
This must
include some sort of border checks either between Ireland and Northern Ireland,
or between Great Britain and Northern Ireland. Although the backstop has been
removed, we have classic diplomatic fudge to replace it. It is a no-go for the
DUP.
21. However, with a view to facilitating the movement of goods across borders, the Parties envisage comprehensive arrangements that will create a free trade area, combining deep regulatory and customs cooperation, underpinned by provisions ensuring a level playing field for open and fair competition, as set out in Section XIV of this Part.
B. Tariffs
22. The economic partnership should through a Free Trade Agreement ensure no tariffs, fees, charges or quantitative restrictions across all sectors with appropriate and modern accompanying rules of origin, and with ambitious customs arrangements that are in line with the Parties’ objectives and principles above.
It is proposed that there will a common free trade area. This is effectively a customs union in all but name. By implication, external tariffs and regulations will have to be the same, retaining discriminatory trading with the outside world, such as in beef and sugar. Note that it is not “free trade” in true sense of the term, but trading abiding by the same detailed regulations across the trading area. This will likely preclude Britain achieving trade agreements with other countries that are not compliant with those of the EU.
25. Such facilitative arrangements and technologies will also be considered in alternative arrangements for ensuring the absence of a hard border on the island of Ireland.
There is no
current solution to the Northern Ireland border question. A hard border between
Ireland and Northern Ireland will not be ruled out in the future if talks break
down.
III. SERVICES AND INVESTMENT
A. Objectives and principles
27. The Parties should conclude ambitious, comprehensive and balanced arrangements on trade in services and investment in services and non-services sectors, respecting each Party’s right to regulate. The Parties should aim to deliver a level of liberalisation in trade in services well beyond the Parties’ World Trade Organization (WTO) commitments and building on recent Union Free Trade Agreements (FTAs).
This is
effectively the aim of the customs union. Why is Jeremy Corbyn, as a hard-left
socialist, so determined to stay in a customs union that supports liberalization
of the bastions of capitalism? That is banks and stock markets. This withdrawal
agreement will tie the hands of a future Labour Government just as much as
being a full member of the EU.
VI. CAPITAL MOVEMENTS AND PAYMENTS
41. The Parties should include provisions to enable free movement of capital and payments related to transactions liberalised under the economic partnership, subject to relevant exceptions.
In the same
vein, a future Corbynista Government will be prevented from stopping capital
flight.
48. Noting that the United Kingdom has decided that the principle of free movement of persons between the Union and the United Kingdom will no longer apply, the Parties should establish mobility arrangements, as set out below.
The ending of free movement was always going to apply to any
withdrawal agreement.
XII. FISHING OPPORTUNITIES
71. …
72. …
73. Within the context of the overall economic partnership the Parties should establish a new fisheries agreement on, inter alia, access to waters and quota shares.
74. The Parties will use their best endeavours to conclude and ratify their new fisheries agreement by 1 July 2020 in order for it to be in place in time to be used for determining fishing opportunities for the first year after the transition period.
The agreement fails to guarantee that the UK will take back control
of its own waters. The EU is unlikely to allow the UK to have a policy of “British
waters for British vessels”.
XIII. GLOBAL COOPERATION
75. The Parties recognise the importance of global cooperation to address issues of shared economic, environmental and social interest. As such, while preserving their decision-making autonomy, the Parties should cooperate in international fora, such as the G7 and the G20, where it is in their mutual interest, including in the areas of:
a) climate change;
b) sustainable development;
c) cross-border pollution;
d) public health and consumer protection;
e) financial stability; and
f) the fight against trade protectionism.
76. The future relationship should reaffirm the Parties’ commitments to international agreements to tackle climate change, including those which implement the United Nations Framework Conventions on Climate Change, such as the Paris Agreement.
If the British people ever saw sense and wanted to come out
of the useless and costly Paris Agreement, the climate consensus could prevent
this happening through the courts.
XIV. LEVEL PLAYING FIELD FOR OPEN AND FAIR COMPETITION
77. Given the Union and the United Kingdom’s geographic proximity and economic interdependence, the future relationship must ensure open and fair competition, encompassing robust commitments to ensure a level playing field. The precise nature of commitments should be commensurate with the scope and depth of the future relationship and the economic connectedness of the Parties. These commitments should prevent distortions of trade and unfair competitive advantages.
This concept is peculiarly British, especially associated with
Eton. Adhering to this perspective of a single set of rules for everyone is the
likely reason that most of the major sports in the world, including football,
tennis, golf, cricket and rugby are of British origin. However, it is
contradiction with current discrimination on the basis acceptance of core
beliefs. One is in Post Normal Science (especially on climate change) where
lack of acceptance of a politicized mantra such as “climate change is happening, is serious, human caused and solvable”
puts one beyond the pale of rational argument. Another is in politics, where
failure to accept consensus intellectual beliefs (such as membership of the EU,
or the need to abolish capitalism) is sufficient to charge that person with being
deluded, or an outright liar. For this reason alone, those on the left, or the
more rabid remainers, would be hypocritical to support a deal.
II. GOVERNANCE
B. Management, administration and supervision
126. The Parties should establish a Joint Committee responsible for managing and supervising the implementation and operation of the future relationship, facilitating the resolution of disputes as set out below, and making recommendations concerning its evolution.
127. The Joint Committee should comprise the Parties’ representatives at an appropriate level, establish its own rules of procedures, reach decisions by mutual consent, and meet as often as required to fulfil its tasks. As necessary, it could establish specialised sub-committees to assist it in the performance of its tasks.
This part I quite like. It is the two parties coming
together as equals to work through and resolve differences.
C. Interpretation
128. In full respect of the autonomy of the Parties’ legal orders, the Union and the United Kingdom will seek to ensure the consistent interpretation and application of the future relationship.
There may be a lack of suitable candidates from the UK for
the Joint Committee, as this type of interpretation requires that one makes the
effort to understand opposing perspectives. Certainly, many of the remainer MPs
will be disqualified from applying when they lose their current jobs in the
upcoming general election.
D. Dispute settlement includes:-
131. The Parties indicate that should a dispute raise a question of interpretation of provisions or concepts of Union law, which may also be indicated by either Party, the arbitration panel should refer the question to the Court of Justice of the European Union (CJEU) as the sole arbiter of Union law, for a binding ruling as regards the interpretation of Union law. Conversely, there should be no reference to the CJEU where a dispute does not raise such a question.
A good point insofar as UK law is not bound by the CJEU. It
is right and proper that matters of interpretation of Union law should be
referred to this body.
139. This programme will be designed to deliver the Parties’ shared intention to conclude agreements giving effect to the future relationship by the end of 2020 as set out in paragraph 135. The European Commission is ready to propose applying on a provisional basis relevant aspects of the future relationship, in line with the applicable legal frameworks and existing practice.
There is no open-ended process, where the UK will be at the mercy at the EU legislation, as in the previous withdrawal agreement.
What will happen on Parliament’s Super-Saturday?
However, my comments are largely irrelevant, and so is the detail. Parliament will try any means to stop Brexit. On the other hand, Boris Johnson’s determination, clear vision and optimism have resulted in a declaration that is quite different to the withdrawal agreement rejected three times by parliament. Further, the arch remainers are in a bind now that EU leaders have said they do not want a further extension of the Article 50 period. If the question is truly “deal or no-deal” will they compromise or just abstain? Or will there be some other ruse to stop Brexit? In the Brexit battle Boris, no doubt on advice from political strategist Dominic Cummings, has out-manoeuvred his opponents. Whilst Jeremy Corbyn (Lab), Jo Swinson (Lib-dem), and Ian Blackford (SNP) have all said their parties will vote against this revised deal, they have done so by failing to understood the political trap in which they have fallen. If parliament decides to revoke Article 50 of the EU Treaty they will have to order the Prime Minister to pass this onto the EU. This will clearly be in breach of Article 51 of the Vienna Convention on Law of Treaties (1969), as Boris Johnson will only do so under coercion. As such it will make the revocation without legal effect under international law. Further, it is too late to remove the Prime Minister by legitimate means, whilst changing the role of the Prime Minister in the British Constitution at this late stage could be challenged under international law, may not be recognized by the EU and might be received badly by the British public. If the remainers abstain the deal will go through, whilst voting it down will see no-deal Brexit happen by default. Any other ruse may have already been anticipated by Cummings, such as requiring the deal to be approved by a second referendum.
Kevin Marshall

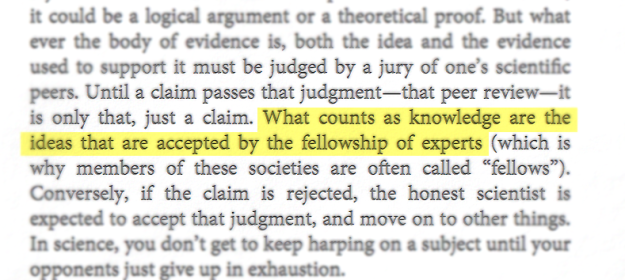
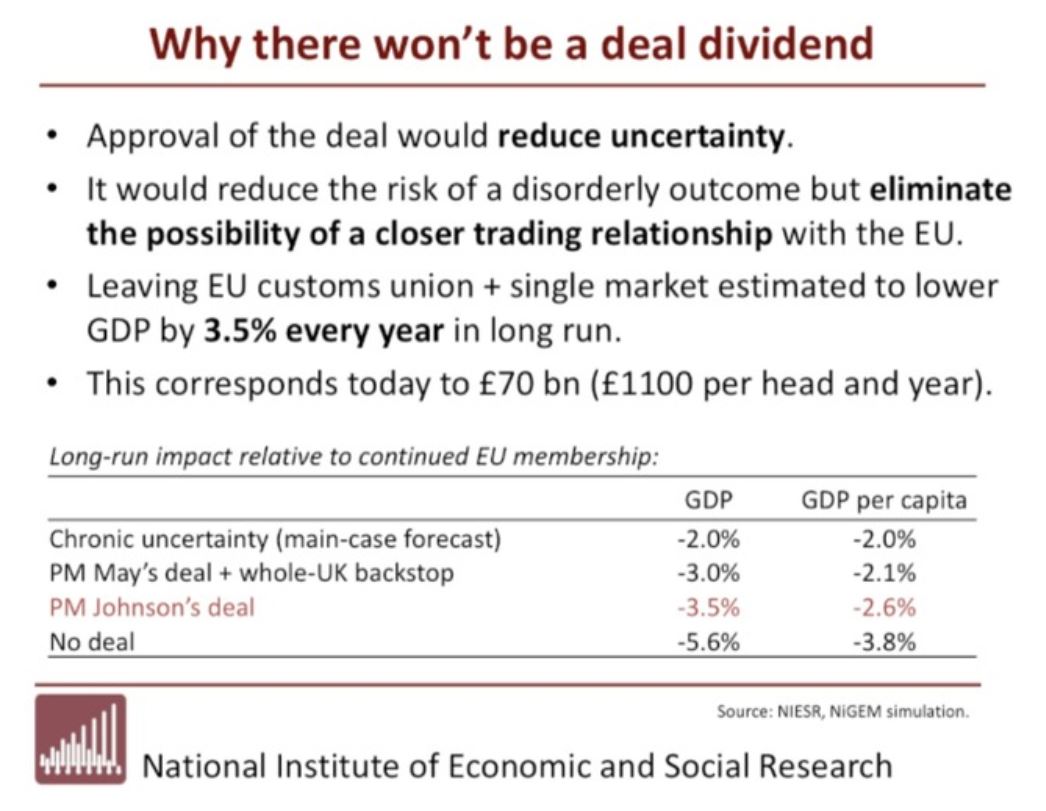
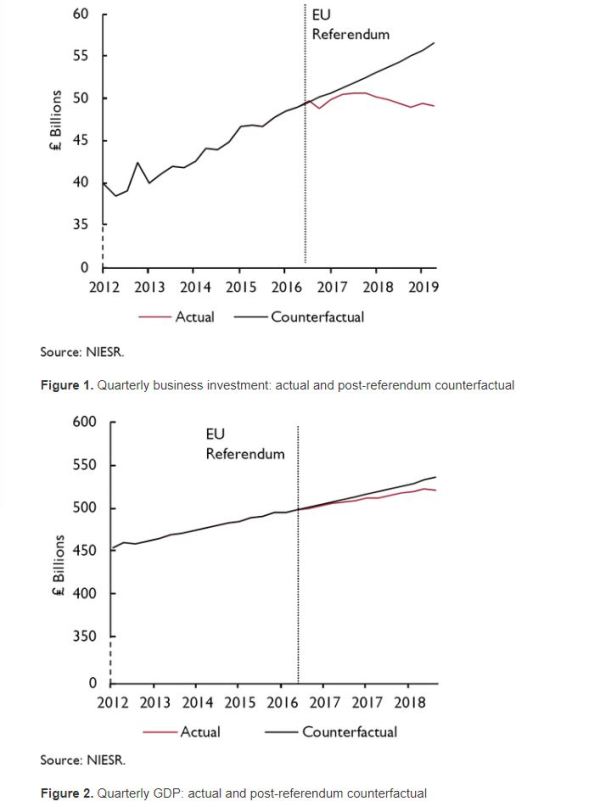 Fig 2 : Figures 1 & 2 from the NIESR paper “Prospects for the UK Economy“