Summary
The Risbey at al. 2014 paper has already had criticism of its claim that some climate models can still take account of actual temperature trends. However, those criticisms did not take into account the “actual” data used, nor did they account for why Stephan Lewandowsky, a professor of psychology, should be a co-author of a climate science paper. I construct simple model using Excel of surface temperature trends that accurately replicates the smoothed temperature data in Risbey et al. 2014. Whereas the HADCRUT4 data set shows the a cooling trend since 2006, a combination of three elements smooths it away to give the appearance of a minimal downturn in a warming trend. Those element are the use of the biases in Cowtan and Way 2013; the use of decadal changes in data (as opposed to change from previous period) and the use of 15 year centred moving averages. As Stephan Lewandowsky was responsible for the “analysis of models and observations” this piece of gross misinformation must be attributed to him, hence the title.
Introduction
Psychology Professor Stephan Lewandowsky has previously claimed that “inexpert mouths” should not be heard. He is a first a psychologist, cum statistician; then a specialist on ethics, and peer review; then publishes on the maths of uncertainty. Now Lewandowsky re-emerges as a Climate Scientist, in
“Well-estimated global surface warming in climate projections selected for ENSO phase” James S. Risbey, Stephan Lewandowsky, Clothilde Langlais, Didier P. Monselesan, Terence J. O’Kane & Naomi Oreskes Nature Climate Change (Risbey et al. 2014)
Why the involvement?
Risbey et al. 2014 was the subject of a long post at WUWT by Bob Tisdale. That long post was concerned with the claim that the projections of some climate models could replicate surface temperature data.
Towards the end Tisdale notes
The only parts of the paper that Stephan Lewandowsky was not involved in were writing it and the analysis of NINO3.4 sea surface temperature data in the models. But, and this is extremely curious, psychology professor Stephan Lewandowsky was solely responsible for the “analysis of models and observations”.
Lewandowsky summarizes his contribution at shapingtomorrowsworld. The following is based on that commentary.
Use of Cowtan and Way 2013
Lewandowsky asks “Has global warming “stopped”?” To answer in the negative he uses Cowtan and Way 2013. This was an attempt to correct the coverage biases in the HADCRUT4 data set by infilling through modelling where the temperature series lacked data. Principally real temperature data was lacking at the poles and in parts of Africa. However, the authors first removed some of the HADCRUT4 data, stating reasons for doing so. In total Roman M found it was just 3.34% of the filled-in grid cells, but was strongly biased towards the poles. That is exactly where the HADCRUT4 data was lacking. A computer model was not just infilling for where data was absent, but replacing sparse data with modelled data.

Steve McIntyre plotted the differences between CW2013 and HADCRUT4.

Stephan Lewandowsky should have acknowledged that, through the greater use of modelling techniques, Cowtan and Way was a more circumstantial estimate of global average surface temperature trends than HADCRUT4. This aspect would be the case even if results were achieved by robust methods.
Modelling the smoothing methods
The Cowtan and Way modelled temperature series was then smoothed to create the following series in red.

The smoothing was achieved by employing two methods. First was to look at decadal changes rather than use temperature anomalies – the difference from a fixed point in time. Second was to use 15 year centred moving averages.
To help understand the impact these methods to the observations had on the data I have constructed a simple model of the major HADCRUT4 temperature changes. The skepticalscience.com website very usefully has a temperature trends calculator.
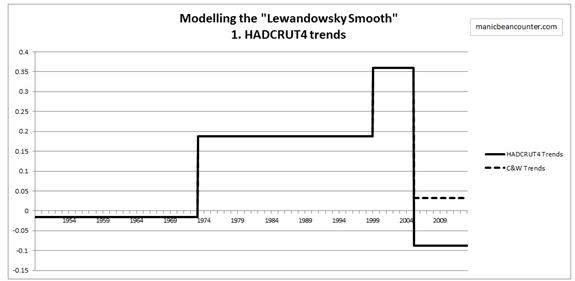
The phases I use in degrees Kelvin per decade are

The Cowtan and Way trend is simply HADCRUT4 with a trend of 0.120 Kelvin per decade for the 2005-2013 period. This simply coverts a cooling trend since 2005 into a warming one, illustrated below.
The next step is to make the trends into decadal trends, by finding the difference with between the current month figure and the one 120 months previous. This derives the following for the Cowtan and Way trend data.

Applying decadal trends spreads the impact of changes in trend over ten years following the change. Using HADCRUT4 would mean decadal trends are now zero.
The next step is to apply 15 year centred moving averages.
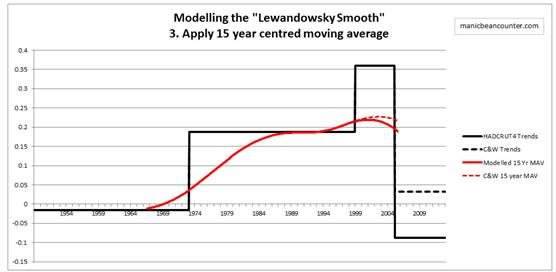
The centred moving average spreads the impact of a change in trend to before the change occurred. So warming starts in 1967 instead of 1973. This partly offsets the impact of decadal changes, but further smothers any step changes. The two elements also create a nice smoothing of the data. The difference of Cowtan and Way is to future-proof this conclusion.
Comparison of modelled trend with the “Lewandowsky Smooth”
Despite dividing up over sixty years of data into just 5 periods, I have managed to replicate the essentially features of the decadal trend data.

A. Switch from slight cooling to warming trend in late 1960s, some years before the switch occurred.
B. Double peaks in warming trend, the first below 0.2 degrees per decade, the second slightly above.
C. The smoothed graph ending with warming not far off the peak, obliterating the recent cooling in the HADCRUT4 data.
Lewandowsky may not have used the decadal change as the extra smoothing technique, but whichever technique that was used achieved very similar results to my simple Excel effort. So the answer to Lewandowsky’s question “Has global warming “stopped”?” the answer is “Yes”. Lewandowsky knew this, so has manipulated the data to smooth the problem away. The significance is in a quote from “the DEBUNKING Handbook“.
It’s self-evident that democratic societies should base their decisions on accurate information. On many issues, however, misinformation can become entrenched in parts of the community, particularly when vested interests are involved. Reducing the influence of misinformation is a difficult and complex challenge.
Lewandowsky is providing misinformation, and has an expert understanding of its pernicious effects.
Kevin Marshall

Brian H
/ 09/08/2014Good dissection.
But for the love of Pete, Kevin, read your own article aloud and listen, maybe recorded. Many sentences are grammar disasters. In some cases, meaning has to be guessed.