Summary
Descriptive statistics, particularly in the form of pivot tables enable a bridging of the gap between the public pronouncements and the high level statistical analysis that can only be performed by specialists. In empirically-based scientific papers, data analysis by spread sheet enables the robust questions to be asked by the non-specialist and the expert reviewer alike. In relation to Lewandowsky et. al 2012, it highlights the gulf between the robust public claims and the actual opinion poll results on which it is based.
Introduction
In a blog post “Drilling into Noise” on 17 September, Stephan Lewandowsky (along with co-author Klaus Oberauer) makes an interesting comment
The science of statistics is all about differentiating signal from noise. This exercise is far from trivial: Although there is enough computing power in today’s laptops to churn out very sophisticated analyses, it is easily overlooked that data analysis is also a cognitive activity.
Numerical skills alone are often insufficient to understand a data set—indeed, number-crunching ability that’s unaccompanied by informed judgment can often do more harm than good.
This fact frequently becomes apparent in the climate arena, where the ability to use pivot tables in Excel or to do a simple linear regressions is often over-interpreted as deep statistical competence.
Now let me put this in context.
The science of statistics is all about differentiating signal from noise. This exercise is far from trivial:
A more typical definition of statistics is
Statistics is the study of how to collect, organize, analyze, and interpret numerical information from data.
So Lewandowsky and Oberauer appear to seem to have a narrow and elitist interpretation.
“it is easily overlooked that data analysis is also a cognitive activity.”
Lewandowsky and Oberauer are cognitive scientists. They are merely claiming that this is within their area of competence.
Numerical skills alone are often insufficient to understand a data set—indeed, number-crunching ability that’s unaccompanied by informed judgment can often do more harm than good.
Agreed – but that implies that what follows should demonstrate something unique, they can only be gained by higher level or “scientific” analysis.
This fact frequently becomes apparent in the climate arena, where the ability to use pivot tables in Excel or to do a simple linear regressions is often over-interpreted as deep statistical competence.
I have not found pivot tables used before to analyse data in the climate arena. Nor have I seen simple linear regressions. The heavyweight statistical analysis from those who dispute the science has centred around one person – Steve McIntyre. In fact, to my knowledge, the first instance of when pivot tables were presented are primary analysis by sceptics was when I published my analysis
I would quite agree that pivot tables are not a replacement for deep statistical analysis. But it has role. My analysis using pivot tables, published on 1st September has a number of things which I identified independently which are not brought out in the original paper. These I present below. Then I will suggest how the reporting in the mainstream media might have been somewhat different if they had seen the pivot table summaries. Finally I will make some suggestions as to how the low level statistical analysis can contribute to relating to more “scientific” statistics.
Analysis using pivot tables
How Many Sceptics?
When I first glanced through the paper at the end of July, I wrote
It was an internet based survey, with links posted on 8 “pro-science” blogs. Five skeptic blogs were approached. As such, one would expect that “pro-science” responses would far outweigh “denialist” responses. I cannot find the split.
On obtaining the data, this was what first looked at. In the posting I looked at the 4 Climate Science questions, classifying into acceptors and rejectors (“denialist”) of the science.

Or summarising into 3 categories
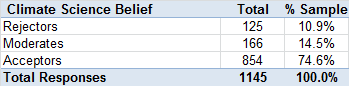
Those who dogmatically rejected every question were outnumbered more than 10 to 1 by those who dogmatically accepted. Those who accept the science comprise three-quarters of the respondents. Most people would believe this to be material to a paper analysing those who reject the science.
NASA faked the moon landing|Therefore (Climate) Science is a Hoax
This is the beginning of the title of the paper. Pivot tables are great analysing this. The row labels are “Climate Science Belief”, the columns are CYMoon, and under “∑ values” enter the count of another column of values.
After a bit of formatting, and three more columns of simple formulas, I got this.
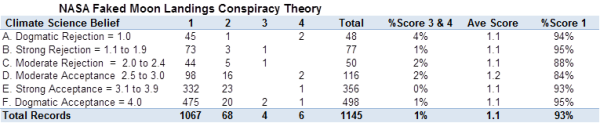
Just 10 out of 1145 respondents agree that NASA faked the moon landings. (I was not the first to publish this result. Anthony Watts piped me by a few hours.)
Strictly this is a claim against the “Climate Change” conspiracy theory CYClimChange and CYMoon. I did this table as well
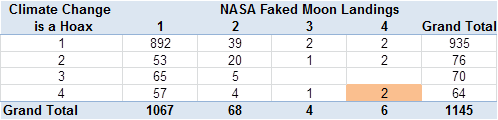
Of the 64 who strongly accept that the climate change conspiracy theory, just 2 also strongly accept CYMOON. Even worse the title is the other way round. So the sample of those who believe NASA faked the moon landings is just 10. The sample size was just too small to make a prediction. Even worse, you could make the wrong result due to the next issue.
Identification of scam responses
One test was to look at the average agreement to each of 12 conspiracy theories that were independent of the climate area. So I rounded the average response to the nearest whole number for each respondent. And then did a pivot table.
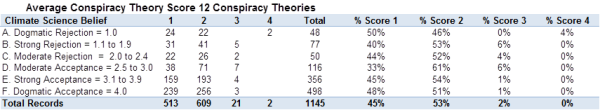
I believe I was the first to identify publically the two that averaged 4 on the conspiracy theories and rejected the climate science. These are the two that Steve McIntyre has dubbed “Super-scammers”.
The biggest conclusion that I see is that the vast majority of respondents, no matter what their views on climate, don’t have much time for conspiracy theories. In fact, if you take out the two super-scammers, the most sceptical bunch are the group that dogmatically reject climate science.
This is confirmed if you take the average conspiracy score for each group.

Taking out the two super-scammers brings the average for the dogmatic rejectors from 1.63 to 1.49. With such small numbers, one or two outliers can have an impact on the data.
Measuring up against the public perception
There were two major newspaper articles that promoted the
The Guardian article on 27th July started
Are climate sceptics more likely to be conspiracy theorists?
New research finds that sceptics also tend to support conspiracy theories such as the moon landing being faked
Even a paper such as the Guardian, which prints all sorts of extremist dogma in denigrating sceptics, would have thought twice about publishing that comment if they had been presented with the tables.
The Telegraph article of 28th August included
“NASA faked the moon landing – Therefore (Climate) Science is a Hoax: An Anatomy of the Motivated Rejection of Science”, was based on a survey of more than 1000 visitors to blogs dedicated to discussion of climate change.
An astute reporter, on the basis of my pivot tables, could reasonably ask Professor Lewandowsky how it follows from just 10 respondents who support the idea that “NASA faked the moon landing” that you can make any sort of prediction about beliefs about climate. The questionnaires were placed on climate blogs, not conspiracy-based blogs, so surely any prediction should be framed the other way round?
It also included
The lead researcher, Professor Stephan Lewandowsky, from the University of Western Australia, said conspiracy theories are the “antithesis to scientific thinking” and those who believe them are more likely to reject the scientific consensus that humans contribute to climate change.
“Science is about weeding out bad ideas,” he told The Daily Telegraph. “With conspiracy theories, you start out with a theory and stick to it no matter what the evidence. So it is not that surprising that conspiracy theorists would not accept scientific propositions … If the scientific evidence is overwhelming and you don’t like the conclusion, you have to find a way to reject those findings.”
An astute reporter, on the basis of my pivot tables, could reasonably ask why Professor Lewandowsky is still sticking to his hypothesis when such small numbers support the wacky conspiracy theories. They may then ask a supplementary question. Given that there were 15 questions on conspiracy theories (14 with results reported), and just 5 on free markets, was not the original purpose to establish the conspiracy theory hypothesis and the secondary one on political orientation?
Suggestions for the Role of Low Level Statistical Analysis
In summary, whilst would quite agreeing that spread sheet analysis using pivot tables are not a replacement for deep statistical analysis there are a number of ways where it can be a powerful aid.
Firstly, it is a quick way of getting a sense of what the data is suggesting. Pivot tables can enable a quick summary visually in lots of different ways. It may need additional classifications, such as my acceptors / rejectors. It also needs thought, and an almost a manic sense of trial and error.
Second, it can give a quick comparison to what is being derived from the higher level statistics or modelling. For scientists it is a way of reviewing the data, to make sure that they have the most important points, and have not gone up blind alleys. For non-scientists (and for those scientists reviewing the work of others) it is a way of quickly getting a sense of whether the conclusions are substantiated by the empirical evidence.
Thirdly, and most importantly, it is a means of communicating to the wider public. It provides a bridge between the mainstream media and the scientists. If climate scientists want to win the trust of the wider public, then they need to relate their work in more intelligible terms, capable of being cross-examined. Instead we have the high level models and a then lot of shouting about how wrong and biased are any criticisms. That leads to a lot of scientists, including Lewandowsky, who are totally incapable of perceiving that they could be wrong, or that there could be even modicum of truth in what the critics say. This denial is best summarized in the graphic displayed in the Lewandowsky and Oberauer posting of the “skeptics” view on recent warming trends. It is a total misrepresentation, used as a means of avoiding intelligent discussion.

Kevin Marshall

simple-touriste
/ 11/06/2014Stephan Lewandowsky really hit the lower bound of peer/pal-reviewed beliefs disguised as science. (I hope it’s the lower bound.)
I don’t think climatic orthodoxy can get any worse.
Also, peer/pal-reviewed looks like a way to filter unorthodox opinion, in the biomedical field: can you get a strong critic of the usefulness of a vaccine published, with focus on the terrible risks of some rare but awful side effects?
I feel there is a strong similarity between climate and vaccines, at sooo many levels, it’s really terrifying. Climate is not weather unless it’s hot outside, and correlation isn’t causation unless vaccination “causes” a decrease of an infectious disease (which decreased everywhere even where no vaccines were used). Of course, dramatic increase of MS and other related diseases after mass hep B vaccination in France does NOT mean causation.
With small doses of radiation, studies which show no link whatsoever with cancer are ignored or criticised (with few arguments) by the official French experts (IRSN). Case-control studies which show a tiny link are appraised. War on radon!
In all these cases, people get called “deniers” all the time.
Is Science the new religion?