In looking at the Indonesian INDC submission, I came across a confusing array of estimates for Indonesia’s total greenhouse gas emissions. These are the ones I found.
| Estimates of Indonesia’s Total Greenhouse Emissions in MtCO2e | ||||
| Dataset |
1990 |
2000 |
2005 |
2010 |
| UNFCCC | 1,101 | 1,444 | 2,829 | 1,908 |
| EDGAR | 1,165 | 622 | 1,171 | 745 |
| WRI CAIT 2.0 | 1,026 | 1,372 | 1,584 | 1,928 |
| WRI Blog | 1,000 | 1,400 | 1,500 | |
| Indonesian Govt | 1,800 | |||
In graph format the figures are:-
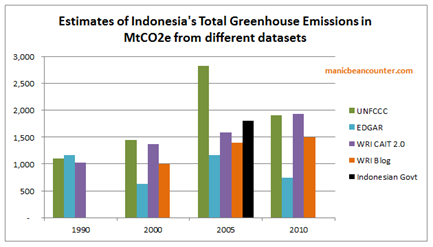
The Indonesian INDC Submission says it will give unconditionally cut emissions by 29% from the BAU of 2881 MtCO2e, it means that in 2030 emissions will be about 100 MtCO2e lower than in 2005 not 1120 MtCO2e lower (UNFCCC) or 530 MtCO2e higher (EDGAR) . But on the basis of the UNFCCC or EGDAR figures by 2010 Indonesia had fallen by a third, so meeting the 2030 unconditional target should prove a doddle. Alternatively, use the World Resources Institute CAIT 2.0 data and Indonesia has unconditionally agreed something much more drastic. Between 2005 and 2010 emissions grow at 4% a year. On that trend, the 2030 BAU becomes 4200 MtCO2e, not 2881 MtCO2e, so the unconditional emissions “cut” is not 29% but 51%.
The worst example is contained in a graph about the Indonesian INDC Submission at the World Resources Institute Blog and reproduced below.

There are a number of things wrong with this graph, including
- Scale is in KtCO2e, not MtCO2e.
- Does not use WRI’s own CAIT 2.0. This is despite WRI claiming it “provides free access to comprehensive, reliable, and comparable greenhouse gas emissions data sets, as well as other climate-relevant indicators, to enable analysis on a wide range of climate-related data questions.”
- Nor does is there any trace of Indonesia’s claimed emissions 1800 Mt CO2e in 2005. So where does this wibbly-wobbly projection come from? The reference includes BAPPENAS 2015 – the Indonesian “National Development Planning Agency”. A search finds this graph.

The figure for 2005 is about 1400 MtCO2e, not the 1800 MtCO2e stated in the INDC. The Indonesian’s have fiddled their own unaudited figures to get a politically desired result – an easily achievable “reduction” in GHG emissions. Even worse, the WRI does check the data. There are minor points that the Indonesian “dalam ribu ton” translates on Google as “in thousand tons“, or that anyone who knows climate data would realize that 1,000,000 MtCO2e is greater than 49GtCO2e, the UNIPCCs AR5 global estimate of GHG emissions in 2010.
Finally, the Carbon Brief, in a recent article says that 1997 was a record for forest fires – a record that may be broken in 2015. Already 1600 MtCO2e has been emitted from forest fires. On this basis, therefore, 1997 total Indonesian emissions are likely to be well in excess of 2000 MtCO2e, and a considerable spike in the record.
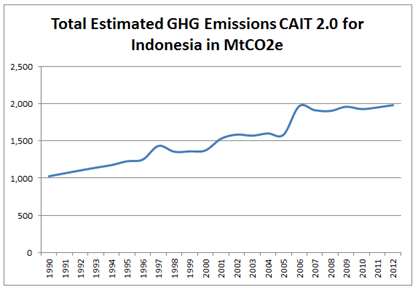
The WRI CAIT 2.0 data, shows a minor spike. The narrower “GHG Emissions from Land-Use Change and Forestry” was estimated at 904 MtCO2e, as against 1321 MtCO2e in 2006. This is nowhere near the implied Carbon Brief 1997 emissions record. The figures
In summary, emissions figures for Indonesia are just arbitrary estimates, based on extremely limited and contradictory data. Both the WRI and the Indonesian Government cherry-pick data to suit their cause. Whether it is justified depends on the purpose. The WRI states their missions clearly.

That is to impose their environmentalist beliefs and perspectives on everybody else.
Indonesia’s INDC submission begins
This is, in my view, a far more rounded and focused mission. Against the environmentalist ideologies of the UNFCCC I believed that in manipulating figures Indonesia is serving the interests of 250 million Indonesians.
Kevin Marshall

Swapan Kumar Mukhopadhyay
/ 08/11/2015How to account for the emission of CO2 and other GHG from volcanic activity in Indonesia?
manicbeancounter
/ 08/11/2015Do not know at all. I do not think that volcanic emissions included in the estimates of total GHG emissions, as these human caused and therefore controllable emissions.