There has been no statistically significant warming for at least 15 years. Yet some people, like commentator “Michael the Realist”, who is currently trolling Joanne Nova’s blog, are claiming otherwise. His full claims are as follows
Again look at the following graph.

Now let me explain it to the nth degree.
# The long term trend over the whole period is obviously up.
# The long term trend has pauses and dips due to natural variations but the trend is unchanged.
# The current period is at the top of the trend.
# 2001 to 2010 is the hottest decade on the record despite a preponderance of natural cooling trends. (globally, ocean, land and both hemispheres)
# Hotter than the previous decade of 1991 to 2000 with its preponderance of natural warming events.
# Every decade bar one has been hotter than the previous decade since 1901.
Please explain why the above is true if not AGW with proof.
The claims against the warming standstill I will deal with in a later posting. Here I will look at whether the argument proves, beyond reasonable doubt, that AGW exists and is significant.
There might be a temperature series, but there is no data on greenhouse gases. There is data on the outcome, but there is no presentation of data on the alleged cause. It is like a prosecution conducting a murder trial with a dead body, with the cause of death not established, and no evidence presented linking the accused to the death. I will have to fill this bit in. The alleged cause of most of the twentieth century global warming is human greenhouse gas emissions. The primary greenhouse gas emission is CO2. First I will compare estimated global CO2 emissions with the warming trend. Second, I then show evidence that the twentieth century warming is nothing exceptional.
The relationship of CO2 emissions to average temperature is weak
Some time ago I downloaded estimates of national CO2 emissions data from what is now the CDIAC website, then in filled my own estimates for all major countries where there were data gaps, using the patterns of other countries and my knowledge of economic history. This shows steady growth up to 1945 (with dips in WW1, the Great Depression and at the end of WW2) The post war economic boom, the 1973 oil crisis, the recession of 1980-81 and the credit crunch of 2008 are clearly visible. It therefore seems reasonable and not too dissimilar from the increase in atmospheric CO2 levels.
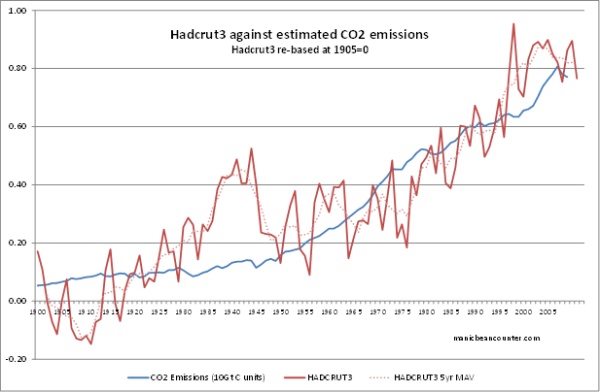
I have charted the growth in human CO2 emissions against the HADCRUT3 data, putting them on a comparative scale. The 5 year moving average temperature increased by around 0.5oC between 1910 and 1944 and 0.6oC between 1977 and 2004. In the former period, estimated CO2 emissions increased from 0.8 to 1.4 giga tonnes. In the latter period, estimated CO2 emissions increased from 4.9 to 7.4 giga tonnes. The period in between the 5 year moving average temperature decreased very slightly and CO2 emissions increased from 1.4 to 4.9 giga tonnes. 1945 and the late 1998 have two things in common – the start of a stall in average surface temperature increases and an acceleration in the CO2 emission rate of increase. On the face of it, in so far as there is a relationship between CO2 emissions and temperature, it seems to be a pretty weak one.
The longer view
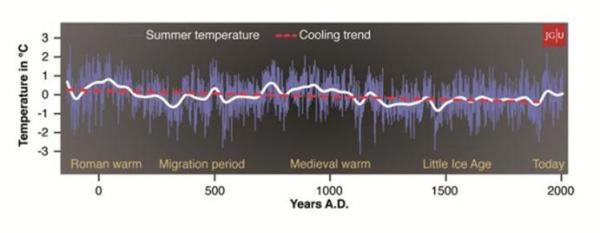
The case for claiming human emissions affect temperature is even weaker if you take a longer perspective. Human CO2 emissions were negligable before the industrial revolution, yet there is plenty of evidence that temperatures have shown larger fluctuations in last couple of millennia. Four example are Law Dome, Esper et al 2012, Gergis et al 2012 and the CO2 Science website.
This Law Dome ice cores are the highest quality ice cores in Antarctica.
There seems to be no warming there at all. With 75% of the global ice packs in Antarctica it is fortunate that there is nothing exceptional about Antarctica warming. But maybe the Arctic is different.
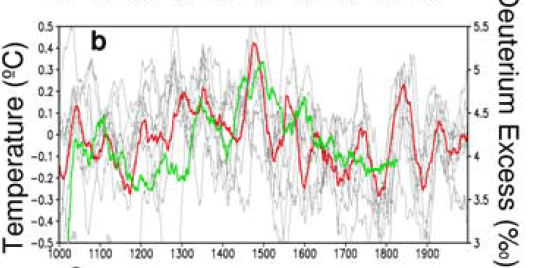
Esper et al 2012, published in Nature, has the following Summer temperature reconstruction for Northern Scandinavia over two millennia.
There is a twentieth century uptick, but only in the context of a long term cooling trend.
Focussing on the last 130 years shows something at odds with the global position.
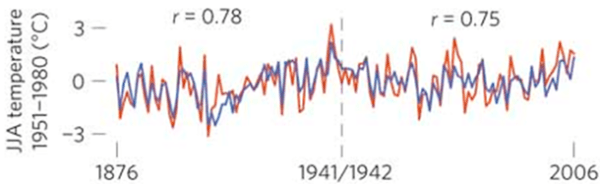
The highest temperatures were in the 1930s, just like the record temperatures in the USA. The warming trend from the mid-1970s is still far greater than the global averages, but less than the warming trends in the early twentieth century. It corroborates data that shows recent warming trends are higher in the Arctic than the global average, but also shows claims that there is nothing significant in these trends.
I find the most convincing evidence is from the withdrawn Gergis 2012 temperature reconstruction for the combined land and oceanic region of Australasia (0°S-50°S, 110°E-180°E). This is because it set out with the aim of showing the opposite – that the recent warming was much more significant than anything in the last millennium. Despite breaking their own selection rules for proxies, they managed to only demonstrate that the last decade of the last millennium the warmest by the narrowest of margins. See below.
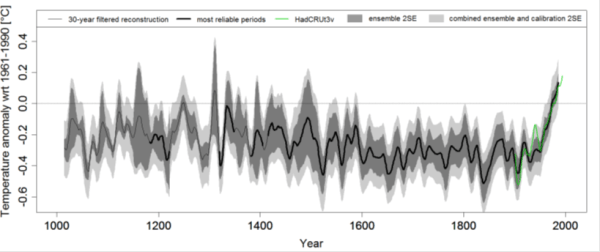
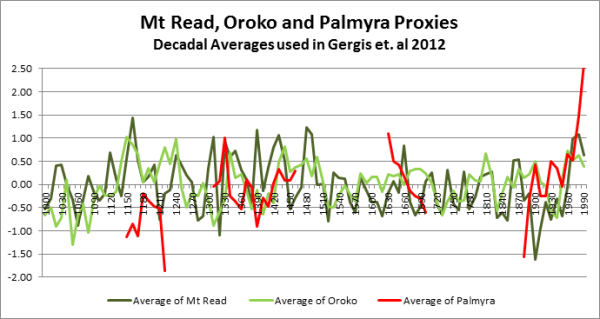
There are many reasons to reject the paper (see here), but one significant point can be illustrated. There were only three reconstructions had any data prior to 1430. There were two tree ring studies from New Zealand, and coral study from Palmyra Atoll. Plotting the decadal averages shows that the erratic Palmyra data suppresses the medieval period and exaggerates the late twentieth century warming. Further, Palmyra Atoll is over 2000 km outside the study area.
Finally, CO2Science.org specialises in accumulating evidence of the impacts of CO2. It also has a database of studies on the medieval warm period. There is a graph that summarizes the quantitative studies
Figure Description: The distribution, in 0.5°C increments, of Level 1 Studies that allow one
to identify the degree by which peak Medieval Warm Period temperatures either exceeded
(positive values, red) or fell short of (negative values, blue) peak Current Warm Period
temperatures.
In conclusion, on the face of it, there is very weak support for human emissions being the cause of most of the warming in the last century by the fact that changes in human emissions do not appear to move in line with changes in temperature. The case is further weakened by evidence that at times in the last 2000 years were warmer than in the current period. It does not discount the possibility that human emissions are responsible for some of the warming. But demonstrating that empirically would mean understanding and accurately measuring the full extent of the natural processes, then demonstrating that these were not operating as strongly as in previous epochs. By definition, the evidence will be more circumstantial than if there was a direct correlation. Furthermore, the larger the actual human impact the more circumstantial will be the evidence.

mrfabsblogMichael the Realist
/ 27/08/2013Your cherry picking again. Your use of hadcrut 3, a superseded non global data set is a dead giveaway and then choosing specific proxies that match your confirmation bias.
At this link you have a compilation of many reconstructions that clearly show that now is the hottest time in the last 1000 years and that the increase is anomolously fast. The uptick in temperatures also starts at the time that the effects of CO2 would be kicking in after a global cooling trend.
The pages paper examines reconstructions from all over the world and determines that both the MWP and the LIA were not global, unlike the current warming with the 2001-2010 decade being the warmest globally, over oean, over land and in both hemispheres. There is no explanation bar CO2 for the warming since the 70’s as most natural factors are in cooling trends.
“Past global climate changes had strong regional expression. To elucidate their spatio-temporal pattern, we reconstructed past temperatures for seven continental-scale regions during the past one to two millennia. The most coherent feature in nearly all of the regional temperature reconstructions is a long-term cooling trend, which ended late in the nineteenth century. At multi-decadal to centennial scales, temperature variability shows distinctly different regional patterns, with more similarity within each hemisphere than between them. There were no globally synchronous multi-decadal warm or cold intervals that define a worldwide Medieval Warm Period or Little Ice Age, but all reconstructions show generally cold conditions between ad 1580 and 1880, punctuated in some regions by warm decades during the eighteenth century. The transition to these colder conditions occurred earlier in the Arctic, Europe and Asia than in North America or the Southern Hemisphere regions. Recent warming reversed the long-term cooling; during the period ad 1971–2000, the area-weighted average reconstructed temperature was higher than any other time in nearly 1,400 years.”
http://www.nature.com/ngeo/journal/vaop/ncurrent/abs/ngeo1797.html
manicbeancounter
/ 27/08/2013I used HadCrut3 because the data is more reliable, as at NASA them seem to “correct” history more often than “The Times” in the novel “1984”. The corrections seemed to go one way – suppressing the 1910-1944 warming and enhancing the more recent warming. Oh, they have many fine reasons for it, but given that it was until recently administrated by James Hansen, the father of global warming, there might be a bit of bias here. Also it is GISS TEMP tends to be an outlier.
Now to the Pages 2K article that you reference is very interesting. Can be accessed direct here.
If you look at the regional reconstructions (top page 5) it backs up my conclusions about the there being significant fluctuations in temperature in the last two thousand years. This is despite containing a zombie version of the Gergis paper mentioned in my posting.
It still includes the Palmyra Atoll reconstruction dicussed above. McIntyre also notes that the extreme C20th warming is due to short-term proxies – that have no corresponding MWP. I did a table the C20th warming rates for the proxies in the original Gergis paper here.
Most interesting for me though is something that Steve McIntyre picks up on in his summary of the Pages2K reconstruction.
On North America, he notes there are two reconstructions – a pollen one ending in 1950 and a tree-ring one ending in 1974.
On the Arctic reconstruction
(this includes Briffa’s notorious Yamal tree-ring proxy, which show a sharp uptick in the late C20th, due to one tree).
On the Europe reconstruction
Being a beancounter to the core, I like to reconcile things. It is a bit like a detective or a historian getting corroborating evidence. Various proxy measures show not much late C20th warming in the Arctic and Europe, yet according to the surface temperature data sets this is where the greatest warming on the planet is. (It was reflected in the AR4 map where, by far, the greatest warming predicted this century to be in the Arctic). The major difference between HADCRUT3 and HADCRUT4 is adoption of the GISSTEMP method of extrapolating much greater distances from thermometers, with the biggest cause for difference being in the Arctic. HADCRUT3 is closer to the proxy data.
mrfabsblogMichael
/ 28/08/2013All your science seems to come form opinion bloggers and not actual science sources. If the pages 2k reconstruction has so many problems surely it can be properly rebutted in the peer reviewed literature, where the real science happens. Your reason for hadcrut 3 is flawed, you are assuming a big conspiracy is misrepresenting the data. Rubbish reason, you could also have used Hadcrut 4, a bit more global. All Temp data sets show the same trends, even the satelites for the warming from the 50’s.
Nobody disagrees that there are natural fluctuations in temperature, the climate has many forcings upon it, the question is what is causing the current warming, and nothing you have put forward changes my contention that the ‘pause’ is nothing more than a decade of predominantly la ninas which even according to skeptic scientists, should have caused cooling. Instead the 2001 to 2010 decade is the hottest on the instrumental record in every parameter, globally, over ocean, land and on both hemispheres. Again no realist scientific explanation ahs been put forward to explain that except AGW. You are just making excuses.
manicbeancounter
/ 28/08/2013First up is emissions data is from the CDIAC website, and the HADCRUT3 data. You make a claim without a check. Your claim is falsified,
Steve McIntyre over the years has shown the failures of peer review. When he first started investigating the original Mann’s hockey sticks, he was the first to ask to see the underlying data. Pages 2K submitted to the AR5 report in the eve of the deadline, and months after external review comments for AR5 were closed.
I give 3 reasons for the preference of HADCRUT3 over GISSTEMP. I do not assume a conspiracy of any sort. Rather a lot of people who have been taught that science is about belief. That belief is not only in the fundamental truth of a prophecy of coming apocalypse, but only also that the means of redemption is obvious. The proclaimed job of science is to better reveal that “truth”, and the job of supporters to shout down that who question that “truth” and thus prevent the world from being saved by the enlightened. It is not conspiracy but dogma. It is not science, but a pseudo-religion dressed as science.
Now what you are avoiding.
1. Your so called “proof” of AGW is lacking something. It has data on the alleged effect (C20th warming), but no data on the alleged cause – human greenhouse gas emissions. Do you agree?
2. Above I show there is no apparent link between C20th CO2 emissions and the pattern of warming.
3. If I used HADCRUT4 or GISSTEMP, the fit would be closer, but still have anomalies.
4. Pages 2K shows considerable natural fluctuations, including two previous warm periods in the last 2000 years. Maybe not as much at in Esper et al 2012 (published in Nature), but there nonetheless. In the absence of an accurate and clear method of deciphering the human signal from the natural signal, it is easier to assert that C20th warming was predominantly due to natural factors, than >100% due to human factors. (The AR4 of 2007 had aerosols as offsetting much of the GHG effect.)
5. Given that the GISSTEMP shows much a greater warming spurt in the late C20th than the second half, and that most the extreme rise is in the Northern Hemisphere (especially the Arctic), is it not surprising that the Pages 2K proxies have most of the Arctic and European warming in the early C20th, with little warming thereafter?
6. Given a lack of comment to the contrary, you accept that your claims about hottest decades is not evidence against warming having stopped. Rather it is what Stephen Lewandowsky terms “misinformation”.
7. That your definition of “Skeptic” is completely at odds with the premier dictionary of the English Language.
To shorten your replies, please refer to the point numbers. I quite realise that I am challenging your deeply held beliefs. However, lack of a reply (or claims without substantiation) I will take as acceptance.
Michael the Realist
/ 29/08/2013“First up is emissions data is from the CDIAC website, and the HADCRUT3 data. You make a claim without a check. Your claim is falsified,”
Well I was talking about your response to my post which was peppered with climateaudit links and links to yourself. I said the science, not the data.
“Steve McIntyre over the years has shown the failures of peer review.”
The old conspiracy excuse. Peer review is the only and best way we have to legitimately advance the science. As it relies on humans it is still subject to errors, but because once published it is subject to critisism from all the experts that read the publication these things are found out in due course, and fixed with other peer reviewed critisism. To equate a biased opinion blogger having a thought bubble and writing what he like without review on his own page for a mainly non expert audience, to a process where a scientist proposes and takes the effort to develop his theory, subject it to several expert reviewers and then publish it in an expert publication is ludicrous.
Your defense in using an old version of hadcrut would make george orwell proud. Gobbledegook.
1. No. It is warming, this fits the theory of AGW as greenhouse gas emissions are increasing. Natural factors are examined and cannot be the cause. All other predictions of AGW caused warming are also occurring, including falling ph in the oceans, melting Arctic, falling global ice volume, rising sea levels, increasing extreme weather especially floods, heat waves and droughts and much more. There is no other plausable explanation put forward that I have seen yet.
2. That is incorrect. CO2 emission have been increasing and temps have been rising, plus all the other observations.
3. The trend with GISS, even against the satelites is the same.
4. Natural factors do indeed exist, but just because we have less information about past natural factors than present ones does not nullify how much we know about present ones. Most significant natural factors that we can measure and are currently aware of since the 50’s have been cooling. Also the 2001 to 2010 decade, the hottest on the instrumental record, has been significantle in the grip of cooling la ninas and falling solar. Despite that it is still hotter than the previous decade with predominantly warming el ninos. This is the proof that you are wrong, even skeptic scientists expected it to cool by now. It is not cooling because it is being overwhelmed by greenhouse gas warming.
5. The fastest warming is in the second half, with .5 degree rise snce the 50’s.
6. No, as I have pointed out, when you take all the science, information and data into account, it is clearly still warming. That statement only works if all your (lack of) science comes from an eyeball look at a cherry picked portion of a graph out of context and ignoring all other data.
7. I use skeptic to be kind and because if I use the term that more accurately describes your behavour I get fake indignation. I actually believe myself to be the skeptic as I look at all the data and information with an open mind.
manicbeancounter
/ 30/08/2013I have approved your comment. Unable to give a reply tonight as is now 00.25 in the morning, and have recently arrived home, after leaving the house 17 hours ago. However, I will reply sometime within the next 48 hours.
There are 5 angles from which I will base my arguments.
1. Analogy with evidence under English Common Law. There is a distinction between direct evidence, circumstantial evidence and hearsay. Hearsay is opinion. Pieces of circumstantial evidence gain weighting if they are corroborated by other pieces of independent circumstantial evidence. They lose weighting if they an alternative story can be pieced together from the same fragments.
2. Within a court of law the jury is more likely to be convinced of the prosecutions case in a clear-cut case if they are able to fully compare with a well-funded defence case. In a recent case in Britain where a peadophile and child-killer was put on trial, it was more the ridiculous excuses that the defence gave, than the prosecutions arguments that resulted in conviction. Conversely, the biggest miscarriages of justice have occurred when the collective brains of the finest detectives have biased by pressure to gain results for outrageous crimes, meaning evidence that might undermine the prosecution has been suppressed, or the jury has been encouraged to based their decision on indignation for the severity of crimes, rather than the evidence available.
3. Evidence of a possible human influence on global temperatures is necessary, but far from sufficient, to establish future catastrophic anthropogenic global warming.
4. A new branch of applied science should learn from the methods of older branches of science, and from various philosophies of science. Science is far from uniform and of different qualities.
5. Climate science is different other empirical science in that it is based on predictions about the future. If the hypothesis of CAGW is true, it will not be susceptible to a proof like in maths (or logic), nor by (as in a criminal case) of “proving beyond reasonable doubt”. It will be nearer to a civil legal case on being on the balance of evidence. That means accurately framing all possible counter-arguments in the best possible terms, and demonstrating why they fail. It is necessary not only to justify your own case but (contrary to human nature) frame the best possible case for a counter-position that you might find repugnant.
Michael the Realist
/ 30/08/2013Let me try to narrow down my argument then a little better.
Trends in ENSO
http://www.esrl.noaa.gov/psd/enso/mei/
Over the last 60 years the net effect is roughly zero. Its a cycle.
Trends from GISS, UAH and Hadcrut 4 since 1950 (roughly when satelites started)
http://www.woodfortrees.org/plot/gistemp/from:1950/mean:12/plot/gistemp/from:1950/trend/plot/hadcrut4gl/from:1950/mean:12/plot/uah/from:1950/mean:12/plot/hadcrut4gl/from:1950/trend/plot/uah/from:1950/trend
Trends are roughly the same from all 3 (Hadcrut missing the poles is the lowest as not global)
Comparing the 2 you can see that we have a distinct warming trend, even though over the whole period the overall effect of ENSO is zero. The decade with predominantly warming el ninos and the really big el nino of 1998 (skeptic cherry picked start year) is 1991 to 2000 is clear. Despite that we still have 2001 to 2010 decade as the hottest decade on the instrumental record, the following decade and with predominantly cooling la ninas. This indicates to me that warming is still continuing as it has stayed warm despite cooling natural factors.
Skeptic scientists agreed that it should have cooled.
“The paper, by John McLean, Professor Chris de Freitas and Professor Bob Carter, showed that the Southern Oscillation Index (SOI), a measure of El Nino-Southern Oscillation (ENSO) conditions, is a very good indicator of average global atmospheric temperatures approximately seven months ahead, except when volcanic eruptions cause short-term cooling.”
http://climaterealists.com/index.php?id=7349
They predicted 2011 would be as cool as 1956, how did they go with that?
Watts also predicted the Arctic was going to recover
Any other cause for the warming?
Sunspots on a falling trend
http://www.woodfortrees.org/plot/sidc-ssn/from:1950/mean:12/plot/sidc-ssn/from:1950/trend
TSI maybe?
http://www.woodfortrees.org/plot/pmod/from:1950/mean:12/plot/pmod/from:1950/trend
Ok, I think that presents a firm argument looking at the evidence and possible causes. The only one I can see is the rising CO2, when looking at all the information and taking the science and all natural factors into account.
http://www.woodfortrees.org/plot/esrl-co2/from:1950/mean:12/plot/esrl-co2/from:1950/trend
Sorry if the previous post came off as a bit aggressive, you must have caught me on a stressful day. I work at a care school for disengaged teenagers, it can get pretty difficult.
manicbeancounter
/ 31/08/2013Michael,
Satellites only started measuring global temperature anomalies in 1979, 34 years ago. 1950 is 63 years ago. They are not comparable time periods. Further, the first satellite – Sputnik 1 – only launched on Oct 4th 1957. The latest UAH figures are Roy Spencer’s website
Plotting any trend for an arbitrary period can hide more than it reveals. Warming rates reached a peak in around 1940. There was flat temperatures from until 1976, a phase of rapid warming to around 1998, then stationery since. Gisstemp is the most biased towards your viewpoint, showing warming since 1998.
Amongst datasets, the most pro-skeptic (with all the biases from the urban heat island effects exaggerating recent warming) is HADCRUT3.
The BEST data, which covers land only (29% of the earth, where warming trends are greater than the oceans.) here.
The UAH data is as here
This shows something clearer than the other graphs. 1998, an El Nino event, seems to have caused a step change in warming. In other comments you propound an idea that La Nina is behind the current warming hiatus. There is a peer-reviewed paper out that supports that contention.
But as Bob Tisdale says:-
mrfabsblog
/ 01/09/2013Your post does not seem to question any of the science that I have put forward, but does seem to miss some of the most important facts. Firstly ENSO IS A CYCLE, AS POINTED OUT, its overall effect in the last 60 years is zero, nevertheless every data set (incomplete or otherwise) shows roughly the same trend and roughly about .5 deg warming over the period. SO NOT EL NINO or LA NINA. Not solar, trends are down. No other obvious significant natural event. So what you have studiously avoided is why the 2001 to 2010 decade is the hottest globally, over ocean, over land and in both hemispheres ALL AT THE SAME TIME, while most significant natural factors are in cooling cycles? Why is it not cooling? Even skeptic scientists expected cooling, it must be a travesty that they cannot explain the cooling. It must be frustrating for you because the logic is simple, based on observation and fact and you cannot explain it away.
Also your defense of Hadcrut 3 is also telling, this data set is the least global of them all and ignores the poles where AGW predicts the most warming. This is deceptive. Also UHI is thoroughly discredited, every actual peer reviewed study on the subject finds its effect is negligible. Why don’t you put your kids first and lets look for solution and start fixing the problem before it is to late.
“We observe the opposite of an urban heating effect over the period 1950 to 2010, with a slope of -0.10 ± 0.24°C/100yr (2σ error) in the Berkeley Earth global land temperature average. The confidence interval is consistent with a zero urban heating effect, and at most a small urban heating effect (less than 0.14°C/100yr, with 95% confidence) on the scale of the observed warming (1.9 ± 0.1°C/100 yr since 1950 in the land average from Figure 5A).”
http://www.scitechnol.com/GIGS/GIGS-1-104.php
mrfabsblog
/ 01/09/2013Just a quick comment on Tisdale trying to use those natural cycles to cast doubt. This displays a lack of understanding of basic physics. Energy is never lost in that way. Basically Earth only gains energy in the form of radiation, mainly from the sun, and loses energy in the form of radiation out to space, mainly IR. These ocean cycles neither create nor destroy energy but rather just move it around the system.
The argument goes thus, if the energy coming in(from the sun) is more than the energy escaping (by ir to space) then energy in the system is increasing and energy will rise. This could be in the form of melting, temperatures, into the oceans, wherever, it will move around. Not always just in temps, because cycles will transfer it around the system. This is similar to the carbon cycle, where the carbon could be in the atmosphere in the form of CO2, slowing down the loss of IR to space or it could be in your body, or in a plant, or in the soils, or in the ocean contributing to acidification etc.
manicbeancounter
/ 01/09/2013I must admit I have not the foggiest notion what you are on about. I stopped studying physics at High School, and have no interest to return to the subject. I rely on observing & analyzing the arguments and comparing with the counter-arguments, However, rather than reject your arguments out of hand I will give you a great big chance to convince me.
1. You seem always to argue without references directly in support of your claims. Where is the basics physics that supports your claims. Wikipedia will do. What is important is showing dumb old me (and a number of similar bloggers at Joanne Nova’s) how this basic physics contradicts Tisdale’s and my common sense notions.
2. I will let you argue from the authority of others. It is less than a week since Bob’s comment, but it has generated a lot of interest. Show me where “pro-science” blogs use such “basic physics” to debunk Tisdale, or commentators on the skeptic blogs.
mrfabsblog
/ 01/09/2013This is the big problem as I see it. The internet has made everybody assume they are an expert. I can’t teach you physics in a post. I have been learning about physics for years, and thats just the physics without all the maths. The world is so amazing that most real science is unintuitive, you cannot understand it with ‘common sense notions’. The internet has been making the human race dumber but thinking they know more, and not leaving science to the scientists. I will need to be brief as I am going out for fathers day in a minute.
As to 1, energy can be transferred in only 3 ways, conduction, convection and radiation. Conduction and convection needs matter to transfer the energy so it cannot be used to transfer energy into space, a vacuum. Up there radiation triumphs as that does not need matter.
http://www.physicsclassroom.com/class/thermalP/u18l1e.cfm
So most of the energy cycles around the system in various forms with no net effect. The ENSO cycles are one of many like this. The effect over time is zero, but it can cause warming over some decades (1991 to 2000) and cooling in others (2001 to 2010). http://www.esrl.noaa.gov/psd/enso/mei/ The point is that the net effect over 60 years is zero, even though temps have increased by .5 degree. The 2001 to 2010 decade should have cooled with the effect of ENSO and solar but it has not. Taking all that information into account, a real unbiased scientist looking at all the evidence would (and does) conclude that warming is continuing, and it must be by CO2 (as most significant natural factors have been examined) and is overwhelming natural factors. Hence ‘pause’.
Please look at the following links to learn enough basics to be able to continue a scientific discussion. Please read openly and for understanding.
Carbon Cycle
http://earthobservatory.nasa.gov/Features/CarbonCycle/page5.php
The Greenhouse Effect Explanation
http://www.windows2universe.org/earth/climate/greenhouse_effect_gases.html
Joannova will not take me off the moderation list, so I have stopped commenting there. She is obviously to threatened by the common sense argument and science I have been presenting.
manicbeancounter
/ 08/09/2013Couldn’t agree more old chap. So why is your opinion better than anyone else? Post up a couple of independent bloggers who defend your views. I can see plenty at JoNova’s blog who think you are both wrong, and fail to engage.
karabar
/ 01/09/2013I fear there may be another, overarching problem.
Michael is an arrogant, self-obsessed, illogical buffoon.
Rather like the PM of Australia in that regard.
Michael the Realist
/ 02/09/2013“Michael is an arrogant, self-obsessed, illogical buffoon.
Rather like the PM of Australia in that regard.”
It would actually be refreshing if somebody could actually comment on the science and answer my questions rather than rely on personal attacks and abuse to hide the fact they have no idea what they are talking about, and shouldn’t be influencing the debate that will affect my childrens future.
Really it is not that hard, put in a bit of effort to actually learn some of the science and basic physics and then reread my posts and think about it. I have kept it as simple as possible. I don’t even need to do blog science rebuttals to argue my case, as manicbeancounter suggested, the basic logic and physics is enough so far.
karabar
/ 02/09/2013I apologise since you apparently took that to be a personal attack.
I thought I was simply stating an obvious fact.
Your posts on JoNova are testament to that assessment.
Michael the Realist
/ 02/09/2013I suppose its hard not to be when I keep putting forward science, logic and rational debate and get 19 personal attacks out of every 20 posts and not one has been able to prove me wrong, here, or on jonova. The warming and AGW is proved. If natural factors, as shown, are in cooling cycles but temps do not drop then we are warming by AGW. When the cycles, that zero out in the long run, go into the next warming cycle, a step change in warming occurs. Without the corresponding actual cooling all you get is the long term warming trend experienced over the instrumental record. Not that had to understand.
karabar
/ 02/09/2013Your fundamental problem is that you do not understand the concept of the science discipline.
Science is not about “proof”. Science is all about disproof.
The null hypothesis; that since time began, changes in temperature or climate have been completely within the limits imposed by the natural order of things, conclusively fits the observed phenomena.
Since there is no DIS proof of the null hypothesis, it is not science to go about concocting competing hypotheses, as you and your ilk appear only to eager to do.
That, in a nutshell Michael, is why 19 out of 20 people recognise your rants as pure bullshit.
mrfabsblog
/ 02/09/2013Karabar, you have just proved that you do not understand what is going on here and the science of the natural world. You are looking for vague excuses to prevent yourself from having to do anything for greed or ideology.
The hypothesis of AGW was put forward over 100 years ago. It is basic science that CO2 is a greenhouse gas, greenhouse gases cause warming, that is basic physics, measurable in the laboratory, in the atmosphere and from satelites. It has been developed into a full blown theory that nobody has been able to disprove for over 100 years. That makes it science as strong as plate tectonics, evolution or the theory of relativity. Considering it has not been disproved it is still recognised as explaining the current status of the natural world and all the observations and consequences that are occurring as predicted. It is dishonest to still be calling it a hypothesis.
The natural influences on climate can be determined, and has. Things like ENSO are known (graph provided above), tsi can be measured, sunspots can be counted, volcanos can be taken into account as they occur, and are. The imbalance between energy coming into the planet from the sun and leaving the planet can be measured and has been and is consistent with AGW, more energy is coming in than leaving. As energy cannot be created or destroyed then that means energy within the planet is increasing. OK, so what part of any of that do you not understand?
The consequences of rising sea levels, melting Arctic, greenland and glaciers, the falling ph of our oceans, increasing heat waves, floods and droughts are all occurring. The loss of crops, moving of species (6km py), more frequent coral bleaching events, changing patterns of fish etc etc are all occurring. So there is no competing hypothesis that comes near to disproving the overwhelming, consistent, strong theory of AGW. Nothing has come even close, which is why 97% of climate scientists and 100% of internationally recognised scientific organisations accept the overwhelming science where less than 3% of the peer reviewed papers cast any doubt on AGW.
So under the weight of all of the above, why should I worry why 19 out of 20 people who, by their own admission know very little about actual science and are motivated by greed or ideology use abuse to hide their lack of knowledge. Any person who ignores all the above for some vague null hypothesis defence that they do not understand, to do nothing, despite the consequences for future generations, don’t really deserve my respect.
Manic bean counter said above: “I must admit I have not the foggiest notion what you are on about. I stopped studying physics at High School, and have no interest to return to the subject. “
karabar
/ 02/09/2013You are beyond help, Michael. You are caught up in the evil web of a cult. Until you open your eyes and your mind you will never understand, grasshopper. I fell sorry for you.
mrfabsblog
/ 02/09/2013Lol, feel free to argue with some actual science whenever you actually learn some (crickets chirping). Your excuses and overarching reliance on personal attack is very telling and obvious.
manicbeancounter
/ 02/09/2013Michael,
The Greenhouse Effect might be “basic physics” as you call it, but the magnitude of the impact of a change in greenhouse gases on temperatures is far from established. Human emissions have not gone up in line with human emissions or CO2 even if you look at GISSTEMP post 1950. The longer the period, the less the relationship. More importantly is the impact of that warming on humanity and the planet. Even the IPCC AR5 draft there was an admission of no evidence of extreme weather changes. The claims to the contrary in AR4 in 2007 were speculation.
As for qualifications in science, I have none. Just a BA in economics. But I did a course in philosophy of science, and have read widely on both since. What is you qualification in basic physics Michael? Do you realise that climatology, in so far as it is a science is an applied science, reliant on empirical measurements? Like economics, there are different ways of measuring highly complex data, so that the results are usually more reliant on assumptions made, the modelling procedures, the statistical procedures and the data selected than on the physics.
For outsiders (and in a diverse subject, even full-time researchers cannot be fully expert in every area) you have to be reliant on opinions and data. That leads to whose opinions and whose data. Also you need to consider is the quality of the science. The best way to assess the quality of the CAGW hypothesis (i.e. a prediction of future climate catastrophe) is short-run predictive successes. That is pretty poor.
Climatology is not only an applied science, but still an infant one. Practioners need to learn from the mature and successful sciences, rather than pretending they are equivalent. For policy – and the “science” is the servent of policy, climatologists are not the experts, but economists and public policy-makers.
I explored these issues earlier this year.
mrfabsblog
/ 02/09/2013Even your graph above shows fairly good correlation with CO2 and temperature.


It is simplistic to expect temps to go up as a straight line, it is a planet, there are many natural factors. These include unpredictable factors like the sun and volcanos. Then there are cyclic factors like ENSO,PDO etc whos net effect will be zero. This means that on top of the continuous warming effect of the increasing CO2 you have natural factors that may enhance the warming, or be opposing the warming, providing downward pressure on the trend. Naturally this would mean that you would have up, down and pauses but with a distinctive upward trend. This is exactly what is observed over the entire instrumental record.
The impact is as I have already outlined and is giving the impression that it will be much more sensitive to changes in temps than thought. Things like increasing trends in sea level, hot days over cold days (up by 3 to 1 and 5 to 1 at night) are a definite fingerprint of AGW as night time temps are not affected by the sun, trends in extreme precipitation up by 7% per degree, statistical studies of droughts like Russia in 2010, Europe in 2003, the US last year etc are showing that these events are unlikely to have occured without AGW they are so outside the norm, falling ph of the oceans, falling Arctic ice etc are all happening faster and worse than expected. So a lower sensitivity may not be very comforting.
http://climate.nasa.gov/key_indicators/
The IPCC did not admit there was no evidence of extreme weather, this is a misrepresentation. So basically it is evident there is a warming trend, it is evident that despite current natural cooling trends we are not cooling and that when the trends go neutral and warming that there will be another spike and a resumption of warming as has happened several times before in the record. Consequences are largely worse than expected. So going on so much obvious evidence, the actual science, and the severity of the consequences on current and future generations, it is immoral and unethical to do nothing on the small % that the science may be wrong. Its short run predictive success is pretty good and all predicted effects are occurring. To wait for certainty will be waiting until it is to late as due to lags in the climate system we will continue getting worse for 30 years before we are able to turn it around. Do you have kids?
“Now it appears that the assessment was too optimistic. The latest data from across the globe show that the planet is changing faster than expected. More sea ice around the Arctic Ocean is disappearing than had been forecast. Regions of permafrost across Alaska and Siberia are spewing out more methane, the potent greenhouse gas, than models had predicted. Ice shelves in West Antarctica are breaking up more quickly than once thought possible, and the glaciers they held back on adjacent land are sliding faster into the sea. Extreme weather events, such as floods and the heat wave that gripped much of the U.S. in the summer of 2012 are on the rise, too.”
http://www.scientificamerican.com/article.cfm?id=is-global-warming-happening-faster-than-expected
“The world experienced unprecedented high-impact climate extremes during the 2001-2010 decade, which was the warmest since the start of modern measurements in 1850 and continued an extended period of pronounced global warming.
Precipitation and floods: The 2001-2010 decade was the second wettest since 1901. Globally, 2010 was the wettest year since the start of instrumental records.
Most parts of the globe had above-normal precipitation during the decade. The eastern USA, northern and eastern Canada, and many parts of Europe and central Asia were particularly wet.
According to the WMO survey, floods were the most frequently experienced extreme events over the course of the decade. Eastern Europe was particularly affected in 2001 and 2005, India in 2005, Africa in 2008, Asia (notably Pakistan, where 2 000 people died and 20 million were affected) in 2010, and Australia, also in 2010.”
http://www.wmo.int/pages/mediacentre/press_releases/pr_976_en.html
karabar
/ 02/09/2013My condolences Michael. I am sure you will recover from your hallucinations eventually. Get well soon!
Michael the Realist
/ 03/09/2013See below a quote straight out of Joanne Nova’s book ‘The Skeptics Handbook’. The section about common responses to people who make no attempt to talk about the evidence. I have provided lots of science and evidence above, you have made no attempt to address it, at all, intelligently or otherwise. You have failed with your own crowd by relying only on personal attacks. I think it is pretty evident which one of us does not have a clue and is suffering from hallucinations. The piece is talking about a warmist (not a realist like me) that is using ad hominem attack as evidence, and how silly it is.
Page 12
“Common Responses (no attempt to talk about “evidence”)
C. Ad hominem attack
What would you know, you’re
not a climate scientist.
So? Neither is
Al Gore.
I know what evidence is. (Do
you?)
I can read a graph.
You are a denier.
Name-calling is the
best you can do?
I could be a frigid fascist or an
oil sheik, that doesn’t change the
satellite temperature record. My
opinions don’t affect ice core data.
You’re an oil company shill.”
karabar
/ 03/09/2013Listen up, Snicklefritz it is time someone told you where the bear shit in the buckwheat. You do not have any “evidence”. Trolling around on the Internet to find garbage to copy and paste is not “evidence”. In your last diatribe, you make out that a dozen or so failed lab experiments “prove” something.
You do not understand the concept. First, you need to DISPROVE the null hypothesis, which still stands. Science is not about running around looking for things to “prove” when there are perfectly logical simple explanations available. That is why you never progress beyond your present state of ignorance. And this is criticism; not an ad hominem attack. Accept it as advice as it is intended.
mrfabsblog
/ 03/09/2013Firstly please actually explain your understanding of the null hypothesis and how it applies to the AGW theory. My guess is you are quoting from some opinion blogger and have no idea what it means in relation to an actual earth science. The effects and properties of CO2 are well understood and confirmed by experiment and measurement. You are just making stuff up.
Secondly please point out specifically where I am wrong above using actual data and observations just as I have. Your post is not advice, it is further confirmation that you need to make continuous excuses and personal attacks because you are unable to disprove my post and have nowhere else to go, but are unwilling to admit it.
manicbeancounter
/ 03/09/2013Michael,
You do not need to make guesses about what the null hypothesis is about. This is Wikipedia’s take
It applies to AGW theory, as the hypotheses are empirical relationships. With highly complex, and essentially chaotic, systems it is only by testing the data using a battery of statistical tests that you can disprove the null hypothesis. Without the null hypothesis, and without such rigorous testing all the data and observations will only confirm what you want to believe.
These is another dimension that you seem to miss. It is not just finding a relationship that matters for AGW, it is finding that relationship is non-trivial, and adverse. For instance, finding out that the North of Scotland is to become as warm as Edinburgh and Edinburgh as warm as London today should by a matter of rejoicing for the Scots. It would make the land of my ancestors a tad more habitable.
mrfabsblog
/ 04/09/2013Going by your explanation the null hypothesis has been disproved. Statistical reports have already determined that many of the recent extreme weather events like the russia heat wave of 2010 and Europe of 2003 were unlikely to have occurred without the influence of AGW. Trends in extreme precipitation have been determined to increase by 7% for every degree, hot day records over cold day records are up 3 to 1 and 5 to 1 at night (known AGW fingerprint as no sun at night.). Another fingerprint is stratospheric cooling while troposphere warms. Then there is the measurement of the imbalance between energy in to the planet when compared to energy leaving with the decline in wavelengths leaving being in the bands related to CO2 absorption.
Apart from all this there is the fact of the long term warming trend, culminating in the hottest decade on record being 2001 to 2010 during a decade of predominantly natural cooling effect so not natural variation. Proven above.
Your silly scotland comments shows how deceptive you are being. Global warming does not translate to even gentle warming everywhere, just as like it only takes 6 degrees of global cooling to send the planet in an ice age. small changes in temp can have huge effects. Regional effects will be extensive and disruptive as is already occurring with rising and acidifying sea levels, arctic melting, increasing extreme weather of floods, heat waves and drought etc.
karabar
/ 03/09/2013Oh, Michael, you’re the clever rascal, aren’t you?
You nailed it. I am an oil company shill.
Yes, Big Oil pays me billions. And so do Big Tobacco and Big Pharm.
All I have to do in return is create the illusion of stability in the world’s climate system.
I have the means to make six temperature datasets appear as though temperatures have changed only within natural variability. The most difficult part, actually is making the UAH and RSS datasets indicate a slight cooling trend for the past twenty years or so. That is because they are the least likely to be fiddled by wowsers like Hansen and McKibbon.
I also have to rewrite all of the history books and newspaper clippings so that they report, for instance, the British Admiralty askance at the loss of id in the Arctic…….in the late nineteenth century. I also have to “correct” the diaries of early explorers, such as Charles Sturt that reported thermometers breaking open at 143 Fahrenheit in the shade of a Coolamba tree in the centre of Australia, and create reports in nineteenth century of flocks of birds falling from the sky due to the heat.
The most difficult part is to alter the historical record so that hurricanes, tornadoes, floods, and other extreme weather is actually less frequent no that it has ever been in recorded history.
The easy part is to make all of the plant life appear greener form space, and increase crop yields to levels never recorded in the history of agriculture world wide. This is of course the only empirical result observed that can be attributed to the increased proportion of atmospheric CO2. The secret is fertiliser, spilling from the mouths of climate scientists by the tonne.
If it weren’t for Trenberth’s wandering, hot spot, it would be impossible to make people believe that calm, pleasant summer days exist. Little do they know they are in the eyes of hurricanes that follow the roaming hot spot.
You probably also guessed at how I create the illusion of constant seal level, and even make it appear to be dropping slightly. The secret is to channel all that heat (you will have noticed that the planet is cooling quite dramatically, with record low temperatures popping up all over the Northern Hemisphere, and recently in Peru) into the ocean trenches where we use it to make steam. The steam is required to inflate the globe like a balloon, so that the dry bits rise, creating the illusion that the seal level is constant when it is in fact rising catastrophically. A fart smeller like you would have already figured that out.
So that is how it’s done. A climate that has not changed significantly in a thousand years or so is all just an illusion. And only a clever bastard like Michael would be able to detect it.
Now I expect that you will keep this quiet. We wouldn’t want this alarming news to escape now, would we? So as a reward, we can offer you your choice of the Sydney Harbour Bridge, the Brooklyn Bridge, or the Hagia Sophia. These rewards are provided by Royal Dutch Shell, Imperial Tobacco, and Glaxo Smith Kline.
mrfabsblog
/ 04/09/2013Karabar it must be embarrassing to be unable to answer my questions with actual science and observations. I also did not call you an oil shill, that was a direct quote from jonova inregards to people using ad hominem attacks as an argument.
“I have the means to make six temperature datasets appear as though temperatures have changed only within natural variability.”
WRONG. All data sets show the same distinct warming trend with all 3 of them having the 2001 to 2010 decade the hottest to any previous decade. This is despite being dominated by known cooling trends as pointed out above with actual observations. So proven not to be natural variability. I know you can’t explain it, hence the need for frivolity and lies.
http://www.woodfortrees.org/plot/gistemp/from:1980/mean:12/plot/gistemp/from:1980/trend/plot/rss/from:1980/mean:12/plot/uah/from:1980/mean:12/plot/rss/from:1980/trend/plot/uah/from:1980/trend
Anecdotal comments from the distant past do not even count as data, let alone science. Actual science shows that our record melt of the Arctic has not occurred for at least 1400 years.
There are many studies proving the increasing trends in extreme weather. A bit of a summary is in this report from the WMO. No historical tweaking necessary, they are facts.
http://www.wmo.int/pages/mediacentre/press_releases/pr_976_en.html
Some temporary greening does not change the fact that there have been massive crop losses around the world, in Russia, US, Spain, Europe etc due to extreme weather. Also a gentle warming is not the consequence of global warming, there are massive regional differences and other effects, such as the lowering ph and warming of the oceans, sea level rises, increasing heat waves, longer droughts etc.
http://iopscience.iop.org/1748-9326/8/3/034018/article
The hot spot is not a unique fingerprint of AGW.
Sea levels are above trend and predictions.
http://sealevel.colorado.edu/
Shouldn’t have to repeat this but you can see on any graph that temps are at their high point. Extreme european weather has been linked to a destabilised jetstream due to the warming arctic.
http://www.pnas.org/content/early/2012/02/17/1114910109.abstract
I am amazed at how little you know and how so willingly you are at making stuff up and hoping nobody checks. Please check all of the actual data and science I have linked to before you continue embarrassing yourself.
karabar
/ 05/09/2013I see you have been out in the orchard picking cherries again. If life is just a bowl of cherries, you shouldn’t be surprised to find yourself constantly in the pits.
I have pretty well given up on you. You will never amount to anything unless you understand the concept. You seem to think that if you find an opinion somewhere on the net, you have ‘proven’ something. You are virtually beyond hope. Science is simply not about ‘proving’ things. As more knowledge is accumulated, many such things are discovered to be false. That’s why it is imperative that if an investigation is not Popper falsifiable, it is not science. It is politics or religion.
You seem to think that finding some nonsense on the ‘net is “science” or “proof”. If you wanted to, you could find proof on the internet that the moon is green cheese or the sky is pink with purple polka dots.
For instance you troll around and find some opinion on temperatures, not realising that recently the UK Met Office had to admit, on the insistence of Lord Donohue, that “the warming shown by the global-temperature record since 1880 (or indeed 1850) might be reasonably attributed to natural random variation. Additionally, the Met Office needs to reassess other claims that it has made about statistically significant climatic changes.”
Now Michael, that is the UK Met Office at Hadley, responding to a question in the British House of Lords.
As for the Arctic, the cyclical nature of the extent of ice in the Arctic, and its reciprocal behaviour in the Antarctic is well known. You can hardly attribute communiques in the British Admiralty to “anecdotal evidence”, or the journey of the RCMP boat St Roch through the Northwest Passage in the 1940’s can hardly be called “anecdotal evidence”.
Not even the IPCC try the con that ‘extreme weather’ is more prevalent now than previously, or that such events are in any way related. I have some other news. Crop damage due to weather is not new. It’s called farming. There is something new in that regard though. Record crop YIELDS.
The non-existent hotspot was supposed to be THE smoking gun of your religion, until it was nowhere to be found.
I am surprised that you can be so sufficiently gullible to troll around looking for someone to agree with you and then consider that to be ‘knowledge”. I find you particularly pathetic. I really can’t be bothered anymore with your nonsense any longer.
mrfabsblog
/ 05/09/2013For somebody that has given up on me, you seem unable to stop responding. Which would be ok if you actually provided a reasoned scientific argument with references. Like I do. Nothing more to add than what a complet load of unscientific nonsense you write. If you can actually answer the actual science I have presented backed up by the actual data and referenced then I will respond to the science. As it is you are just making stuff up again, proving how little science you actually know. You are an outright liar, otherwise pony up some proof of all of your assertions, (scientific proof) based in all your posts.
mrfabsblog
/ 05/09/2013“You seem to think that if you find an opinion somewhere on the net, you have ‘proven’ something. ”
Just like to point out that all the links in my post above (and most of my references in total) are off the actual data, peer reviewed science or from an international scientific organisation. All the opinion comes from your reference and science free thought experiments.
manicbeancounter
/ 05/09/2013Michael,
Many thanks for all your comments. Some of your comments are very useful, as they are caricatures of much nonsense put out by the climate change consensus. Other comments are unique to you. As they are quite shallow, it is easy to rebut them. But rather than try to answer all your errors and evasions, I have put down some points that show why I believe climatology exists in a world quite separate from other academic and professional disciplines.
I may revise it over time. For instance, in my comment on quality of evidence, I mention the issue of “false positives”. It perhaps should have a comment on its own.
I think that you have above average intelligence, but have never done a science degree, or a semi-science degree like economics. One aspect of studying is that you learn how to argue a point, and also how to argue against something you disagree with. I have been writing articles here for over six years now, and the act of writing helps me think through the issues. Utilizing your own blog should help in this process. I will happily link to it.
One of the reasons I am so sceptical of “climate science” is that I studied economics when the post-war keynesian consensus had been shattered. The discipline was asking the very questions that the climate consensus is seeking to ignore, like whether the subject is true science, and the boundaries of what can be said.
karabar
/ 06/09/2013An excellent text on the subject forms part of Eli Godratt’s “Theory of Constraints” and is published as the business novel “Necessary but not sufficient” ISBN13: 9780566084508
Michael the Realist
/ 06/09/2013I actually do have a science degree and I am actually a teacher, and it is obvious to me, (having spent a lot of time with avoidance prone teenagers), that you make all these excuses and avoid my central question, because you can’t answer them. There is very little actual science displayed on your blog, from yourself or your supporters. Mainly focused on conspiracy theories and totally made up misinformation, not based on science or the data and the typical continuous personal attacks. Fairly lacking in reality and reasoned logical debate. You can lead a horse to water but you cannot make them drink, if you will not learn then nobody can make you. i am clearly wasting my time, you guys are seasoned and master evaders. Every time I have these debates it confirms my views and those of the mainstream science as nobody yet has been able to explain away my reasoning and logic, or counter the science and data that I reference.
karabar
/ 06/09/2013Pity the poor students if this is the quality of “teaching” nowadays! One hopes that your syllabus doesn’t include “reason and logic”.
manicbeancounter
/ 08/09/2013Michael,
I have spent quite a while on rebutting your claims. You are quite welcome to comment, so people can compare and contrast the arguments.