A new summer temperature reconstruction using of tree ring densities in Northern Scandinavia stir, raising some difficult questions for those who believe that C20th warming was caused by human activity
There are a couple of elements that corroborate sceptical beliefs that are not alluded to elsewhere.
Pointer to a low influence of CO2
There has been a decline in summer temperatures of 0.6 degrees.
From the abstract
Solar insolation changes, resulting from long-term oscillations of orbital configurations1, are an important driver of Holocene climate2, 3. The forcing is substantial over the past 2,000 years, up to four times as large as the 1.6 W m−2 net anthropogenic forcing since 1750
That is (From the supplementary information figure S13), a decline in temperatures of around 0.6 Celsius is due to a net reduction in orbital forcings of 6 W m−2.
From a 1998 article by Sherwood Idso* on climate sensitivities,
a total greenhouse warming of approximately 33.6°C sustained by a thermal radiative flux of approximately 348 W m–2
That is 6 W m−2 gives approximately 0.6 degrees temperature change. This implies 1.6 W m−2 gives approximately a 0.16 degree temperature change, so CO2 is not the largest influence on C20th warming.
Pointer to the global temperature adjustments being wrong
Yesterday I reblogged pieces of evidence by Steven Goddard indicating that the historical temperature record has been systematically manipulated. In particular, the inter-war warming has been reduced, whilst recent warming has been increased. From the paper, this abstract of the more recent warming trends.

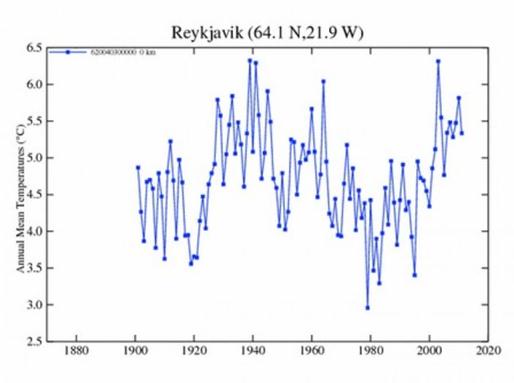
Now compare with two versions of the Reykjavik mean temperatures to see which is closer. I know that Reykjavik is between 50 and 350 miles south of the area surveyed, but it does seem to corroborate one version over the other.


A possible alternative explanation to the lower late C20th temperatures is in the comments at NoTricksZone. DirkH says
The line actually becomes unreliable from 1912 to the present as it is done with a “100 year spline filter” the paper says. Don’t give to much on the shape of the final wiggle. Can’t find any more information but obviously the window for the filter shrinks near the end, how will it react? Dunno…
Hu McCulloch ain’t too impressed: (2009)
http://climateaudit.org/2009/08/23/spline-smoothing/
*Joanna Nova has a summary here.

Brian H
/ 30/07/2012And let us not forget that the assumed “1.6 W m−2 net anthropogenic forcing since 1750” is purely speculative, so that leaves the field almost entirely to Sol.